 by Ariana E. Anderson, PhD; Steven P. Reise, PhD; Stephen R. Marder, MD; Maxwell Mansolf, MS; Carol Han, BS; and Robert M. Bilder, PhD
Dr. Anderson is with the Department of Psychiatry and Biobehavioral Sciences and the Department of Statistics, Dr. Reise is with the Department of Psychology, Dr. Marder is with the Department of Psychiatry and Biobehavioral Sciences, Mr. Mansolf is with the Department of Psychology, Ms. Han is with the Department of Psychiatry and Biobehavioral Sciences, and Dr. Bilder is with the Department of Psychiatry and Biobehavioral Sciences and the Department of Psychology—all from the University of California Los Angeles, Los Angeles, California.
Funding: This work was supported by sponsored research to UCLA by Janssen Research & Development, LLC and the National Institutes of Health (NIH)—(National Institute of Mental Health UL1DE019580, R01MH101478, PL1MH083271 to RB, R03MH106922 to RB and AA; and by the National Institute on Aging K25AG051782 to AA.) Dr. Anderson holds a Career Award at the Scientific Interface from BWF.
Disclosures: The authors have no financial conflicts relevant to the content of this article.
Abstract: Objective. Total scale scores derived by summing ratings from the 30-item PANSS are commonly used in clinical trial research to measure overall symptom severity, and percentage reductions in the total scores are sometimes used to document the efficacy of treatment. Acknowledging that some patients may have substantial changes in PANSS total scores but still be sufficiently symptomatic to warrant diagnosis, ratings on a subset of 8 items, referred to here as the “Remission set,” are sometimes used to determine if patients’ symptoms no longer satisfy diagnostic criteria. An unanswered question remains: is the goal of treatment better conceptualized as reduction in overall symptom severity, or reduction in symptoms below the threshold for diagnosis? We evaluated the psychometric properties of PANSS total scores, to assess whether having low symptom severity post-treatment is equivalent to attaining Remission.
Design. We applied a bifactor item response theory (IRT) model to post-treatment PANSS ratings of 3,647 subjects diagnosed with schizophrenia assessed at the termination of 11 clinical trials. The bifactor model specified one general dimension to reflect overall symptom severity, and five domain-specific dimensions. We assessed how PANSS item discrimination and information parameters varied across the range of overall symptom severity (theta), with a special focus on low levels of symptoms (i.e., theta<-1), which we refer to as “Relief” from symptoms. A score of theta=-1 corresponds to an expected PANSS item score of 1.83, a rating between “Absent” and “Minimal” for a PANSS symptom.
Results. The application of the bifactor IRT model revealed: (1) 88% of total score variation was attributable to variation in general symptom severity, and only 8% reflected secondary domain factors. This implies that a general factor may provide a good indicator of symptom severity, and that interpretation is not overly complicated by multidimensionality; (2) Post-treatment, 534 individuals (about 15% of the whole sample) scored in the “Relief” range of general symptom severity, but more than twice that number (n = 1351) satisfied Remission criteria (37%). 2 in 3 Remitted patients had scores that were not in a low symptom range (corresponding to Absent or Minimal item scores); (3) PANSS items vary greatly in their ability to measure the general symptom severity dimension; while many items are highly discriminating and relatively “pure” indicators of general symptom severity (delusions, conceptual disorganization), others are better indicators of specific dimensions (blunted affect, depression). The utility of a given PANSS item for assessing a patient depended on the illness level of the patient.
Conclusion. Satisfying conventional Remission criteria was not strongly associated with low levels of symptoms. The items providing the most information for patients in the symptom Relief range were Delusions, Preoccupation, Suspiciousness Persecution, Unusual Thought Content, Conceptual Disorganization, Stereotyped Thinking, Active Social Avoidance, and Lack of Judgment and Insight. Lower scores on these items (item scores less than or equal to 2) were strongly associated with having a low latent trait theta or experiencing overall symptom relief. The inter-rater agreement between Remission and Relief subjects suggested that these criteria identified different subsets of patients. Alternative subsets of items may offer better indicators of general symptom severity and provide better discrimination (and lower standard errors) for scaling individuals and judging symptom relief, where the “best” subset of items ultimately depends on the illness range and treatment phase being evaluated.
Keywords: Schizophrenia, PANSS, symptom relief, remission, item response theory
Innov Clin Neurosci. 2017;14(11–12):41–53.
Introduction
The Positive and Negative Syndrome Scale (PANSS) in schizophrenia (SZ) is a commonly used tool to evaluate psychiatric symptoms, providing a metric by which treatment effectiveness can be gauged.1 The full scale consists of 30 items assessing symptoms, such as Conceptual Disorganization, Hallucinatory Behavior, and Blunted Affect, as judged by trained raters on a 7-point ordered scale . These item ratings are commonly summed to yield an overall symptom severity score that in turn is used to judge change in symptoms after treatment. PANSS item ratings also have been used to evaluate changes in clinical status, including remission of symptoms.
The Remission in Schizophrenia Working Group previously identified 8 of the 30 PANSS symptoms for which “remission” could be benchmarked.2 The workgroup defined remission as a “state in which patients have experienced an improvement in core signs and symptoms to the extent that any remaining symptoms are of such low intensity that they no longer interfere significantly with behavior and are below the threshold typically utilized in justifying an initial diagnosis of schizophrenia.” Remission also has been described to be a “more stringent standard than [treatment] response.2 Specifically, the workgroup defined remission in SZ by scores of 3 or less (mild) on eight specific PANSS items: Delusions, Unusual Thought Content, Hallucinatory Behavior, Conceptual Disorganization, Mannerisms/Posturing, Blunted Affect, Social Withdrawal, and Lack of Spontaneity and Flow of Conversation.2 In this study, this 8-item subset will be referred to as the “Remission set.”
Item response theory (IRT) analyses of the PANSS have been used to identify how different PANSS items measure symptom severity within specific symptom dimensions.3–6 Most of these studies focused on baseline data, and it remains unclear if end-point or post-treatment data are similar or different in structure. In the first IRT of the PANSS, Santor and colleagues4 used non-parametric IRT to analyze baseline PANSS data from 9,205 patients with schizophrenia, schizoaffective, or schizophreniform disorder who were enrolled in either observational studies or clinical trials. Also using non-parametric models in a follow-up study, Khan and colleagues3 analyzed baseline PANSS scores from 7,187 patients. Levine et al5 used IRT to assess the consistency of the PANSS scale using the same dataset as the original Marder analysis, with a parametric graded response model. Levine did not rank items or propose subsets of items for removal. Weak PANSS items might be sample dependent and could vary across country and stage of illness,7,8 with characteristic changes in IRT models seen between active and placebo interventions.9 Moreover, the methodological approach of ranking items within a factor domain dismisses the usage of the PANSS as a unidimensional measurement when item scores are summed across all domains, implying that the quality of items using these previous analyses are with respect to each subdomain and not the entire PANSS scale.
Although PANSS data have been the focus of many factor analytic studies in a wide variety of samples,10–12 as well as several applications of item response theory (IRT) models to domain subscales,3–5,9 few if any studies have carefully examined the psychometric properties of the total score as reflecting variation on an overall symptom severity dimension, or considered the psychometric properties of the items in the remission subset. A bifactor IRT model would separately identify a general factor that might be independent of other specific factors, thus helping separate out generalized symptoms from specific symptoms. The purpose of the present investigation is thus to better understand and evaluate the psychometric properties of PANSS total scores and the remission set. We aimed to determine 1) how well the total score and/or the general factor identified in an IRT bifactor model work to measure overall symptom severity; (2) if there is a subset of items that might be superior to using the total score to identify patients who achieve “relief” from symptoms (i.e., when symptom ratings are between “absent” and “minimal” in terms of PANSS anchors); and 3) in this sample of individuals studied at the end of their participation in clinical trials, how the remission criteria compare to relief criteria.
To address these questions, we applied a bifactor item response theory13–16 model to a large sample of ratings on subjects diagnosed with schizophrenia assessed at the termination of 11 clinical trials. This bifactor model was specified to allow for one general dimension, representing overall symptom severity, and five specific domain dimensions (i.e., positive, negative, disorganized, excited, and anxiety/depression symptoms) representing unique variation that cannot be explained by a general factor. The utility of subsets of PANSS items, including the Remission set, were compared to evaluate how symptom relief, or mild illness levels, can best be measured.
A brief review of item response theory and bifactor models. The basic goal of applying an IRT model is to use a mathematical model (typically a logistic function) to characterize the relation between individual differences on a latent variable (i.e., trait levels) and the probability of responding in a particular category.17 For example, in the well-known graded response model (GRM)18 for ordered polytomous items, each item is characterized by a set of “parameters” that reflect the strength of the relation with the latent variable (called “discrimination” and symbolized by alpha) and a set of the location parameters (called “thresholds” and symbolized by beta) that indicate the trait levels at which the probability of responding above a given category is 0.50. Finally, trait levels in IRT are typically reported in a z-score like metric such that the mean score in the population is zero with a standard deviation (SD) of 1. Once estimated, these item parameters define the category response curves (CRCs) for a given item. To illustrate, Figure 1 displays the CRCs for four PANSS items that vary in discrimination: alpha=0.65, 0.99, 1.58, and 1.92 for Blunted Affect, Difficulty in Abstract Thinking, Conceptual Disorganization, and Delusions, respectively. For each item, from left to right, the CRCs provide a visual depiction of the probability of responding in Categories 1 to 6 as a function of symptom severity.
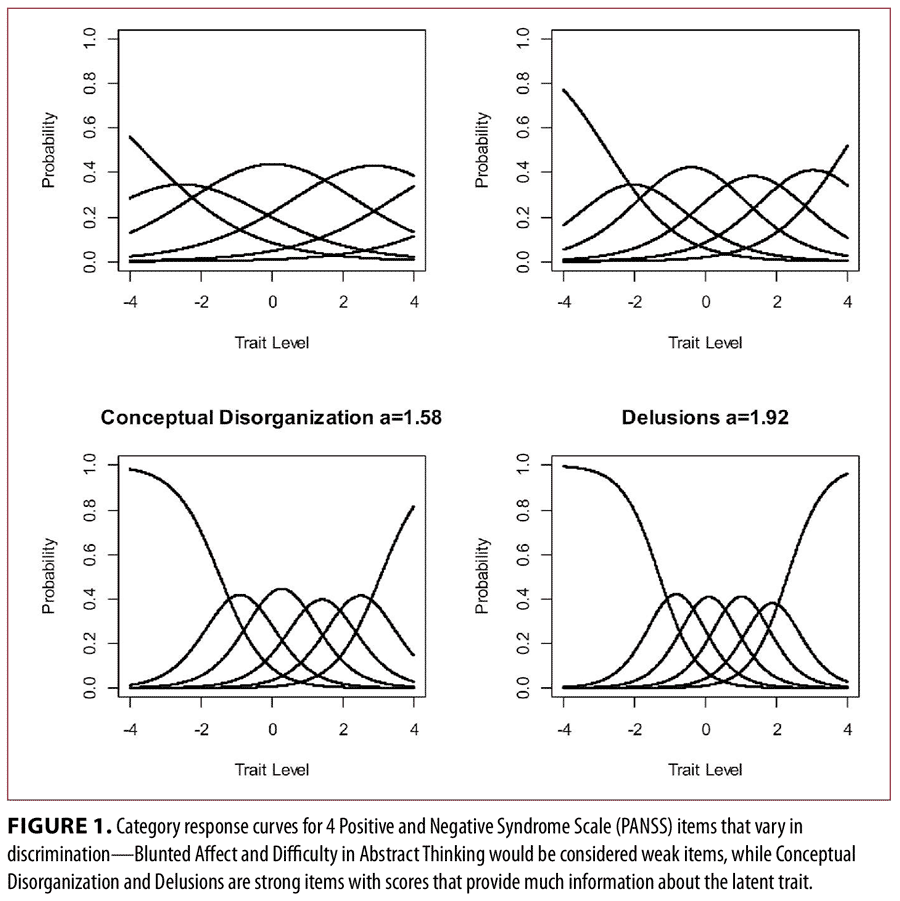
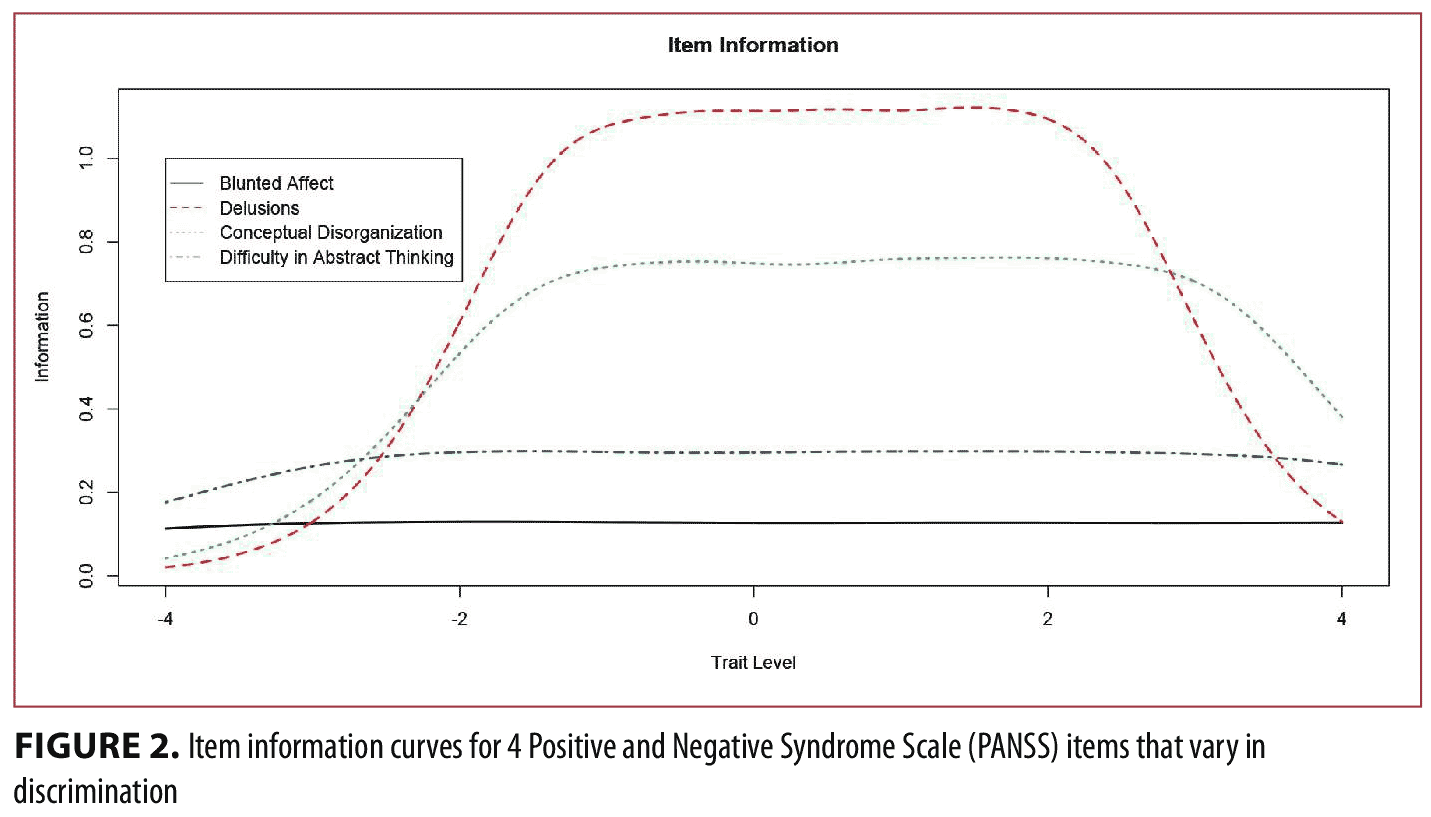
Observe that as the item discrimination increases, the CRCs become more peaked, and are thus more “discriminating” (i.e., responses in particular categories convey more precision in terms of trait standing). A convenient feature of IRT models is that CRCs can be easily converted to item information curves (IICs). For example, Figure 2 displays the IICs for the four items shown in Figure 1. The lowest curve corresponds to the least discriminating item in Figure 1 and the highest curve corresponds to the most discriminating item in Figure 1. Simply stated, items with higher discriminations provide more information, and the location of that information is determined by the threshold parameters. The IRT concept of information is critically important in judging item quality because the amount of information, conditional on trait level, is inversely related to an item’s contribution in reducing an individual’s standard error of measurement. Standard errors of measurement are one divided by the square root of the information. As we will show shortly, item information functions can be added together to form an overall test information curve (TIC) used to judge the overall quality and measurement precision a set of items provides.
Most applications of IRT modeling are application of so-called “unidimensional” models where there is a single latent variable of interest. With the PANSS, however, we know from previous research and our own data explorations that item responses are highly multidimensional. This multidimensionality can severely bias parameter estimates when fitting a unidimensional (one trait) IRT model. However, fitting IRT models within separate factor domains omits the usage of the total PASS score as a measure of illness level and evaluates items only with respect to others in that particular domain. For this reason, in the present study, we fit a bifactor IRT model.15 The bifactor model specifies that each item is an indicator of a general trait (symptom severity here), as well as one secondary specific dimension (e.g., positive symptoms). The general factor and the specific dimensions are orthogonal. As described below, although the bifactor is a multidimensional model, we can ultimately “collapse” the model down into a single dimension in order to study how well PANSS items are reflecting the general trait of symptom severity, while simultaneously controlling for the biasing effects of secondary or nuisance dimensions. Although the specific dimensions are controlled for in the bifactor model, we can derive CRCs and IICs in a bifactor model that are analogous to their unidimensional IRT model counterparts.
Methods
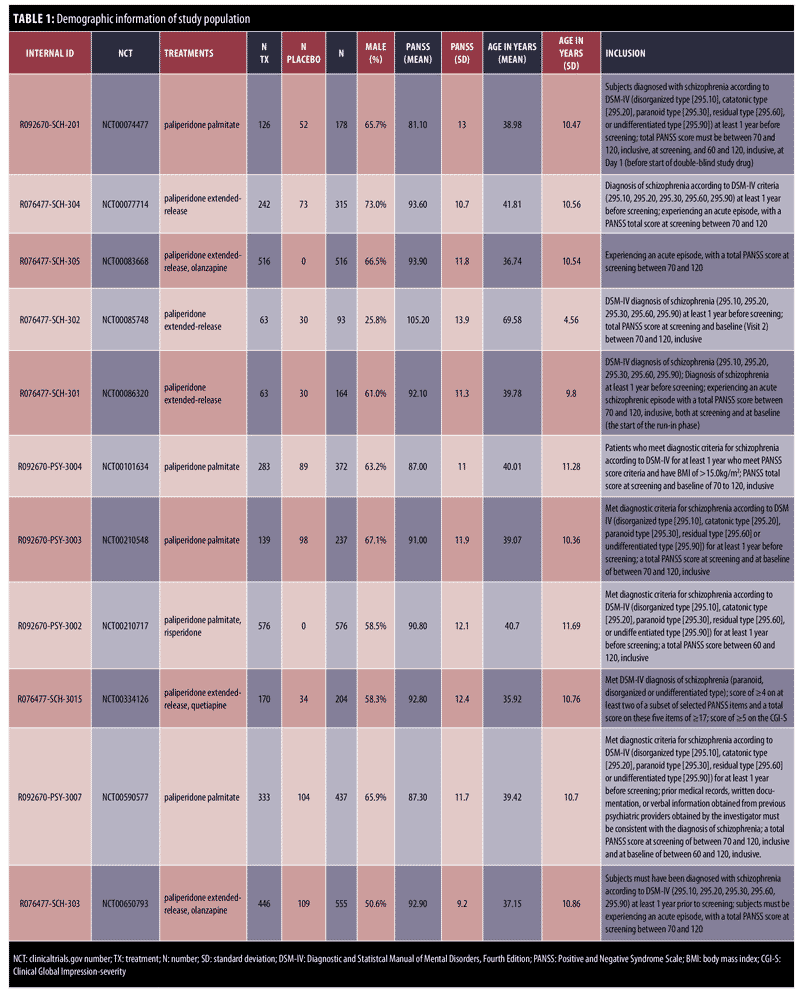
Data and demographics. A total of 3,647 subjects with SZ from 11 different trials were included in this study and are detailed further in Table 1. The Item Category 7 was infrequently endorsed, so was recoded to Item Category 6. A total of five different medications (paliperidone ER [extended release], paliperidone palmitate, olanzapine, quetiapine, and risperidone) were compared with a placebo intervention. All subjects were off antipsychotic medications at the baseline assessment. All subjects provided written informed consent after receiving a complete description of the study, which was conducted in accordance with the latest version of the Declaration of Helsinki. The length of time varied from 1 day to 5 days depending on the study so not all subjects were strictly medication-free because of washout variability. Benzodiazepines were allowed to certain limits to control agitation. All except one SZ trial used PANSS scores of 60 to 120 or 70 to 120 for inclusion criteria. Further details are published in the original articles (Table 1).19–29
Fitting the bifactor IRT model. Factor analysis. Our ultimate goal is to fit a bifactor IRT model with one general factor (representing global symptom severity) and five specific domain factors (positive, negative, disorganized, excited, and anxiety/depression symptoms). Prior to fitting the IRT model, we first conducted a set of exploratory and confirmatory factor analyses to 1) judge the viability of a bifactor structure for the PANSS data, 2) determine the degree to which each item loads on the general factor and each of five specific domain factors, and 3) identify items with sizeable cross-loadings on multiple factors. Such items are known to bias bifactor solutions depending on the degree of violation.30 Specifically, we conducted an exploratory bifactor factor analysis using the Schmid-Leiman technique available in the psych library31 in R 3.41 (R Core Team, 2017) using minres estimation and oblimin rotation of polychoric correlations. We then fit both unidimensional and bifactor confirmatory factor models using diagonally weighted least square (DWLS) estimation available in the lavaan package32 in R. Our goal of these preliminary analyses was to judge the fit of a bifactor structure using standard indices (CFI, RMSEA, and SRMR) and to test the superiority of a bifactor model relative to a unidimensional, single trait, model.
Finally, we also used the confirmatory bifactor solution to compute two important indices. The first is the explained common variance per item (ECVI), which is simply an item’s squared loading on the general factor squared divided by the communality. ECVI values from 0.50 to 1.0 indicate that the item is a more “pure” univocal measure of the general factor (symptom severity here), and ECVI values less than 0.50 indicate that the item is a relatively better measure of a specific dimension. We also computed two model-based reliability coefficients, omega and omega hierarchical (omegaH).33 Omega values indicate the degree to which observed scores reflect all reliable sources of common variance (i.e., the general factor and the five specific factors). OmegaH reflects the degree to which variance in total scores reflects the general symptom severity factor. As omegaH values approach 1, total scores are unambiguous indicators of relative standing on the common dimension, uncontaminated by specific dimensions. The difference in omega and omegaH indicate the degree to which reliable variance is contaminated by the multidimensionality of the items.
Estimating IRT bifactor model parameters.
A bifactor IRT model was estimated using the mirt34 library in R. The model specified one general factor and five specific domain factors, where each item was allowed to load on the general and only a single specific factor. For each item, the model estimated five discrimination parameters per item (one for the general, and five for the specific dimensions), and four intercept parameters (one for each between category boundary).
These estimated parameters are called “conditional” parameters and reflect the relation between the item and each latent trait conditional on the other traits being zero (i.e., at the mean of the other dimensions). As such they are difficult to meaningfully interpret.14 We thus transformed the conditional IRT parameters into so-called “marginal” parameters using the formula provided by Toland et al.35 These marginal IRT parameters better reflect the relation between trait standing and the item responses. Finally, the marginal IRT parameters were used to construct a pseudo-IRT unidimensional model that included only the general factor (symptom severity) and excluded the specific factors using methods described by Toland et al.35 In this final model, each item has a single discrimination parameter and five thresholds. In turn, this final model was used to derive CRCs and IICs for each item, as well as other derived indices.
To judge the psychometric qualities of the remission set, two analyses were performed. First, we computed the remission status for each subject using the criterion defined for the Remission set (i.e., item scores less than or equal to 3). We then used the final IRT model to estimate each individual’s standing on the latent trait using expected a posteriori scoring (EAP).36 We then compared the distribution of symptom severity scores for the judged remitted versus non-remitted groups. Second, we computed TICs based on just the eight Remission set items to discern how discriminating this item set is with respect to symptom severity and where along the latent trait the Remission set provides the best discrimination. For comparative purposes, we derived TICs for three alternative eight-item sets and compared them to the Remission set. Specifically, we formed TICs based on eight items that A) had the highest IRT discrimination parameter (i.e., the most discriminating items), B) had the highest ECVI (i.e., the most univocal items), and C) provided the most information in the low trait/ symptom relief range, where low was judged as trait standing of omega=( -1,-4).
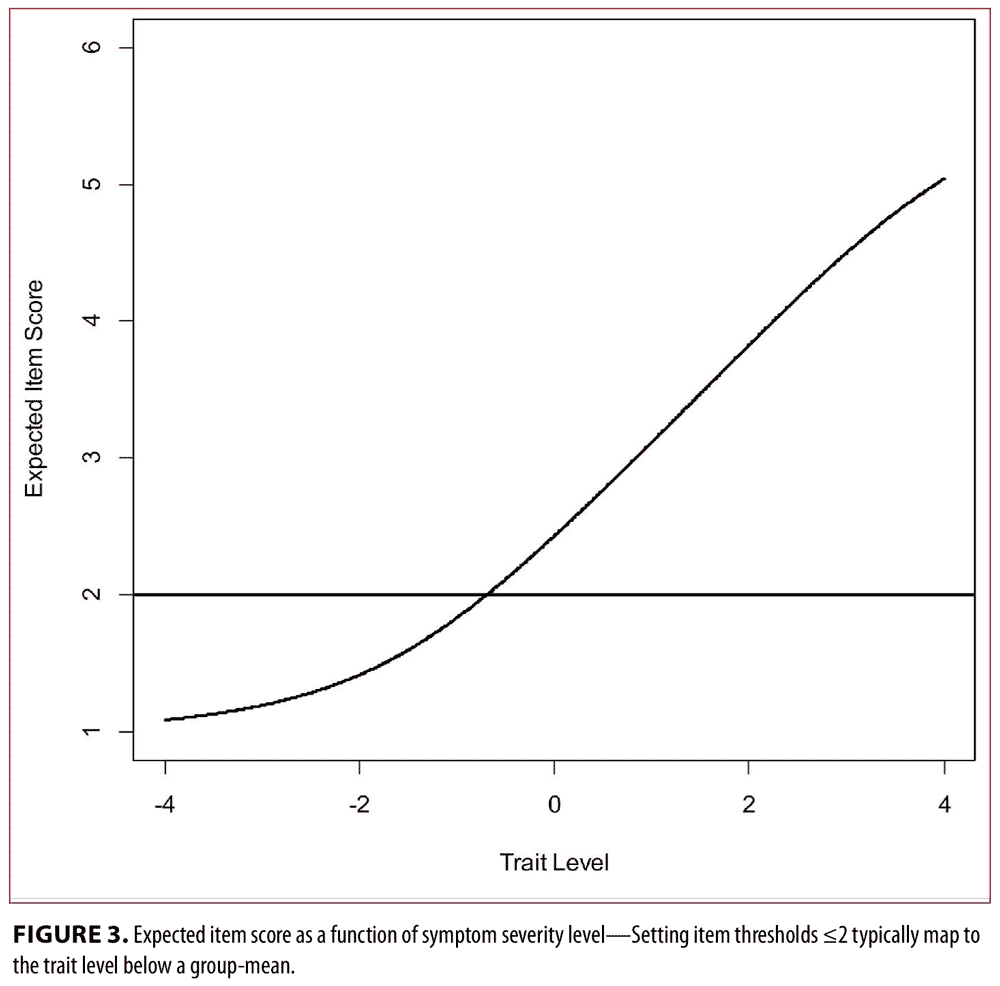
This trait level value was selected based on the item rating anchors of the PANSS (1=absent, 2=minimal, 3=mild, 4=moderate, 5=moderate/severe, 6=severe, 7=extreme). The theta value was selected based on inspection of an expected average item response that was based on linking the item score metric to the latent trait metric using a test response curve, which is basically the weighted sum of CRCs divided by 30 (items). This curve is shown in Figure 3. We used this curve to discern the value of the latent variable that predicts an item score of 2 (minimal) or less. At trait level= -1, the expected item score across all 30 items is 1.83, which lies between the score anchors of either “Absent=1” or “Minimal=2” on the PANSS scale.
Results
Standardized factor loading results for the exploratory and confirmatory bifactor models are shown in Table 2. Items belonging to the eight-item Remission set are bolded and italicized. In the exploratory Schmid-Leiman analysis, all items loaded significantly on the general factor and loaded highest on the hypothesized specific factor. However, 10 items have sizable (>0.20) cross-loadings on multiple group factors. This violates the assumed independent cluster structure of the confirmatory bifactor model (i.e., each item loads on one and only one specific factor) and thus will be a source of misfit and possible parameter bias in the confirmatory bifactor model and subsequent bifactor IRT model.
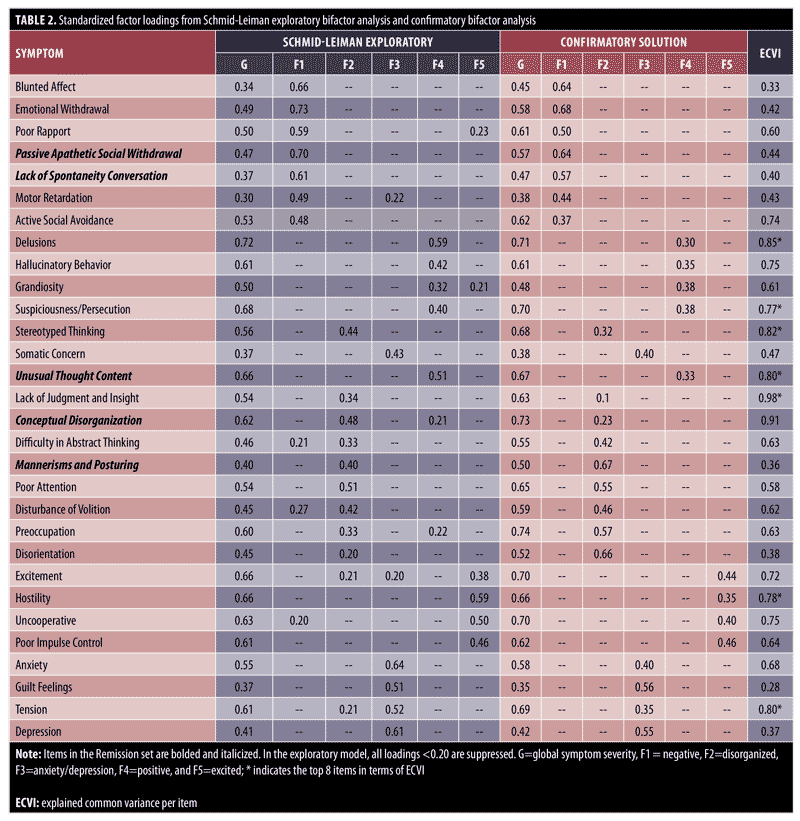
The confirmatory bifactor model in the right panel had a chi-square (x2) of 12,833 (df=375), CFI =0 .97, RMSEA =0.095, and SRMR=0.072. Although the parameter estimates are reasonable and CFI is well above the traditional benchmark of 0.90 (or 0.95), these values indicate only a marginal fit at best. Part of the lack of fit can be attributed to cross-loadings that are forced to be zero in the confirmatory model. Other sources of misfit include small unmodeled correlated residuals. Finally, the fit of a unidimensional model yielded a x2 of 37,872 (df=405), CFI=0.917, RMSEA=0.159, and SRMR=0.123, all indicating that the unidimensional model significantly worsens the fit relative to the bifactor. That is, there is statistically significant multidimensionality in the PANSS ratings that needs to be accounted for by the bifactor model.
The last column in Table 2 displays the ECVI index values with an asterisk (*) next to the 10 items with the largest ECVI. Inspection of these values along with the loadings on the general and specific factors indicate a great diversity in the PANSS items in terms of measurement properties. Specifically, while many items are highly discriminating (i.e., high factor loadings) and relatively “pure” indicators of general symptom severity (Delusions, Lack of Judgment, Conceptual Disorganization), others are better indicators of specific dimensions (Blunted Affect, Mannerisms and Posturing, and Depression). Moreover, the relatively small loadings (<0.50) on specific domain Factors F4 (positive) and F5 (excited) indicate these factors are not well determined. Finally, omega reliability was 0.96 and omega hierarchical was 0.88 indicating that 88 percent of (unit-weighted) total score variation can be attributed to variation in general symptom severity, and only eight percent reflected secondary domain factors. This implies that the total scores are an excellent indicator of symptom severity and interpretation is not overly compromised by multidimensionality.
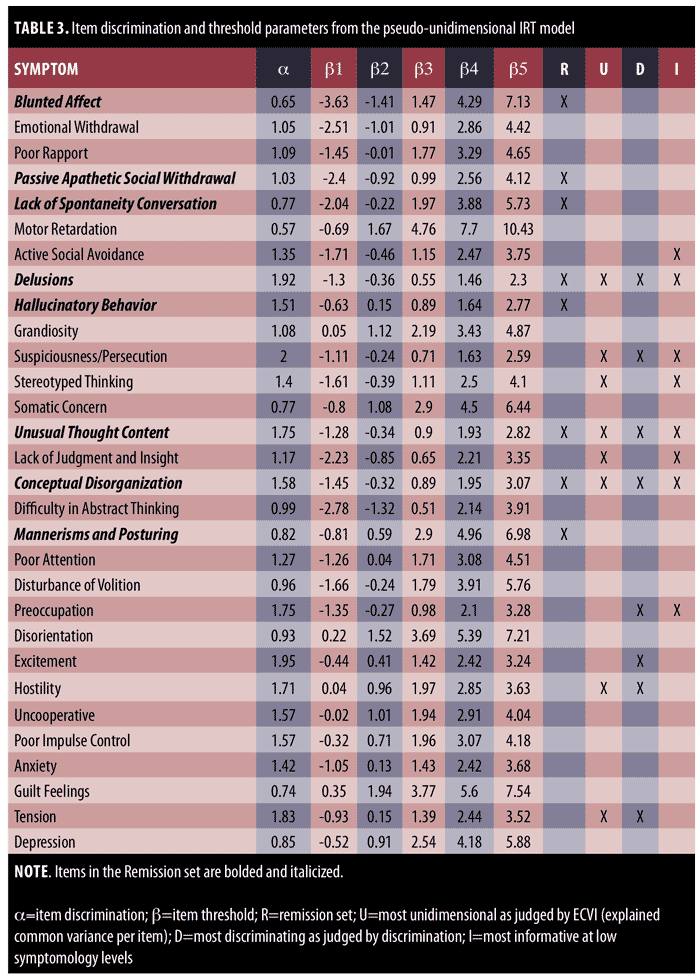
PANSS IRT bifactor model. For efficiency, conditional and marginal IRT parameter estimates are not shown. Instead, Table 3 displays the final “pseudo-unidimensional” IRT model parameters derived from the marginal IRT bifactor model. The column labeled alpha contains the discrimination parameters reflecting how well each PANSS item functions as an indicator of global symptom severity. The columns labeled beta contain the threshold parameters indicating the trait level necessary to respond above a given category. We note that some of these values are extremely high, suggesting problems in category labeling that are beyond the scope of discussion here.
To further evaluate the remission set, Figure 4 displays the TIC for the entire 30 items and for the four 8-item subsets, R, D, I, and U. Figure 4 also displays the corresponding conditional standard errors of measurement. It is clear from these figures that the 30 items provide much better measurement precision relative to any eight-item subset. More importantly, however, it appears that the remission subset is the least informative and thus the least precise subset in terms of scaling individuals on a global symptom severity dimension. Generally speaking, the best subset to judge symptom relief in terms of information and conditional standard error is the set of the most discriminating items. The set based on the information criterion, by design, performs slightly better in the lower symptom severity/ symptom relief ranges (theta is less than or equal to -1).
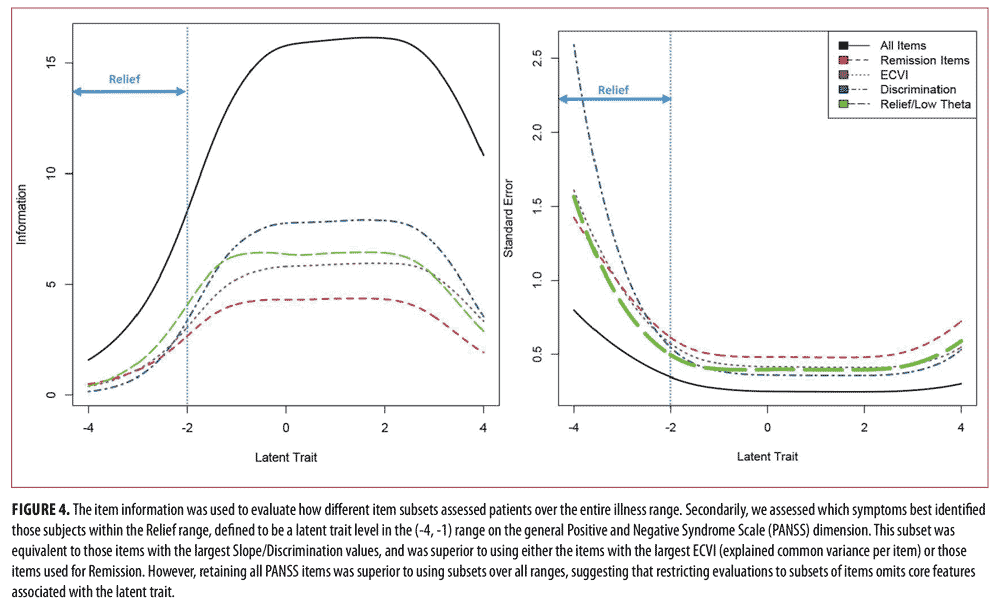
Also, shown in Table 3 are four 8-item subsets. These were derived as follows. The R subset contains the eight items used to judge remission as suggested by Andreasen et al2 The U subset are eight items with the highest ECVI in Table 2. These items are the most univocal or pure indicators of symptom severity. The D subset are the eight items with largest discrimination parameters. Finally, the I subset are the eight items that provide the most information at trait levels less than -1.
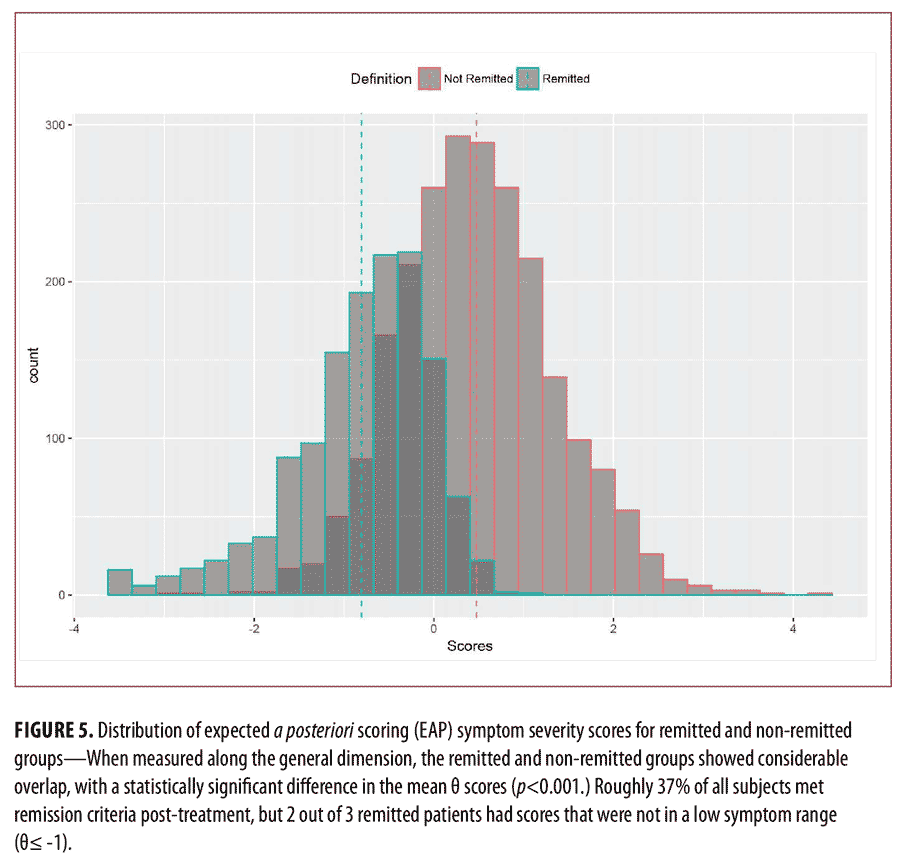
In evaluating the remission set, 37 percent of all subjects met the criteria for “Remission.” Only 1 in 3 “Remitted” patients were in the Symptom Relief range (theta is less than or equal to -1); a “Remitted” patient was twice as likely to have mild or greater symptoms than to have absent/minimal symptoms, as shown in Figure 3. The average symptom severity of a remitted patient was
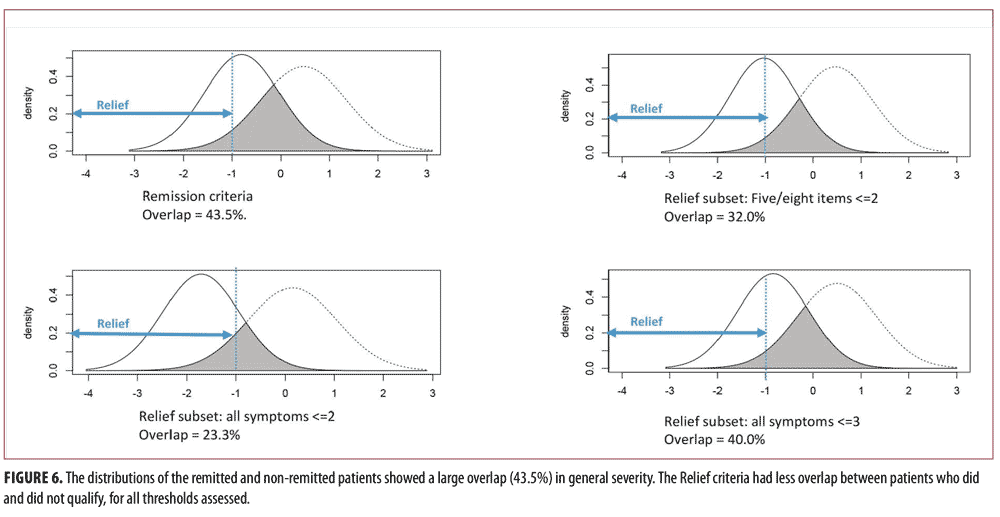
theta= -0.80 (SD=0.77) and the average severity of the non-remitted patients was theta=0.47 (SD=0.86). This difference was statistically significant, but with large overlap between the two groups (Figure 5). The overlap coefficient37 between the Remitted and Non-Remitted Coefficients was 0.435, as shown in Figure 6.
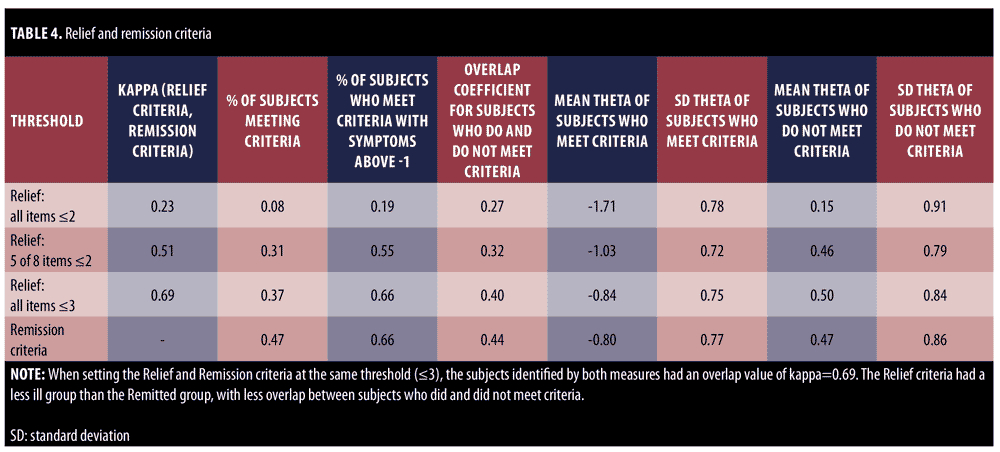
The PANSS symptom thresholds that correspond to “Relief” depend on the sensitivity one wishes to establish. A stricter threshold (all 8 symptoms less than or equal to 2) marks only eight percent of subjects, and 80 percent of subjects within the Relief range for the latent trait theta as shown in Table 5 and Figure 6. The overlap coefficient for this threshold for Relieved and non-Relieved subjects was 27 percent. When instead setting the threshold for Relief symptoms at 3 or less, similar to the Remission criteria, roughly 37 percent of all subjects were considered to satisfy criteria for Relief. The overlap coefficient was 32 percent. However, only one in three of these subjects was in the Relief range for the latent trait theta. Although there were similar percentages of subjects flagged with the Remission criteria, the subjects identified by Relief and Remission were different. The Cohen’s kappa for the Relief criteria and Remission criteria when using the same threshold was 0.69, as shown in Table 4. When using different thresholds (Relief less than or equal to less than or equal to 2), the Cohen’s kappa value was 0.23. Collectively, this suggests that these item subsets differ substantially in the type of patients they identify. The Relief item subset can be set more liberally to include more patients, but the patients that the Relief criteria did identify were, on average, still less ill in general severity than were the individuals identified using Remission criteria, with greater separation between those who did and did not meet the criteria.
Discussion
The overarching objectives of this research were to use a bifactor model, both factor analytic and IRT, to discern how well the PANSS total scores reflect global symptom severity and to what degree meeting the Remission criteria identifies individuals who have low levels of symptom severity. To address the first question, the bifactor models shows that 88 percent of total symptom score variation (omegaH coefficient) can be attributed to variation in general symptom severity, and only eight percent reflected secondary domain factors; thus, there is four-percent error variance. We can conclude from these values that the 30-item PANSS is highly reliable and that total scores predominantly reflect a general latent factor that we termed symptom severity. The results suggest that interpretation of PANSS scores is not overly complicated or compromised by multidimensionality.
On the other hand, not all PANNS items are “good” or “pure” indicators of general symptom severity. In fact, there was large variation with some items being relatively better measures of the general factor than of specific domain factors. This fact needs to be considered in any future short-form versions of PANSS. Ideally, in short form creation, items that have high discrimination on the general factor, are “univocal” measures of the general factor (i.e., with high ECVI), and are balanced across the content domains (e.g., selecting two items from each domain) should be selected. The rationale behind this scale construction strategy and how it yields the most interpretable scores is beyond the present scope, but Stuckey et al16 and Edelen et al36 provide lengthy discussions and examples.
Our analysis of the eight-item Remission set revealed two important findings. First, individuals who were judged Remitted based on scoring 3 or below on the remission set, scored about 0.8 SD lower in the general latent trait theta than non-remitted patients, with 43.5 percent overlap between subjects who were and were not remitted. However, being judged as remitted using these criteria is not associated with symptom relief, where “relief” is defined by low levels of the latent trait reflecting general symptom severity (i.e., trait levels less than theta= -1 corresponding to average PANSS item scores between 1 and 2). Post-treatment, 534 individuals (or about 15% of the whole sample) scored below theta= -1 in symptom severity, but 1,351 subjects satisfied Remission criteria (37%). Second, our analysis of the test information curves for item subsets revealed that the Remission set is not ideal in terms of discriminating individuals along the symptom severity dimension as defined by the bifactor IRT model. In fact, all tested alternative subsets, especially the most discriminating items, outperformed the Remission set in the amount of information measured (Figure 6). The discrimination items were most valuable for testing along the entire symptom range (including high severity), while the Relief set items were strongest for testing in the low-symptom range. One advantage of IRT models is that scores are derivable based on any subset of items, and the metric of the latent variable is easily related to the metric of raw scores. Embretson et al17 provides further discussion on this topic.
The frequency (37%) with which the Remission criteria are met after treatment might be due to multiple sources: a large placebo response could have driven down some item scores artificially, and these short-term gains could disappear within the six-month Remission timeframe. The symptom changes could be due to score-deflation by raters (i.e., given that the expert panel identified symptoms that should identify overall improvement, it is possible that raters anticipated changes in these symptoms even more so than other symptoms that were not identified by the Remission subgroup, suggesting an affirmation bias). Finally, the Remission subgroup constructed these criteria based on relapse prevention trials, suggesting that these studies might be comparing different trial populations.
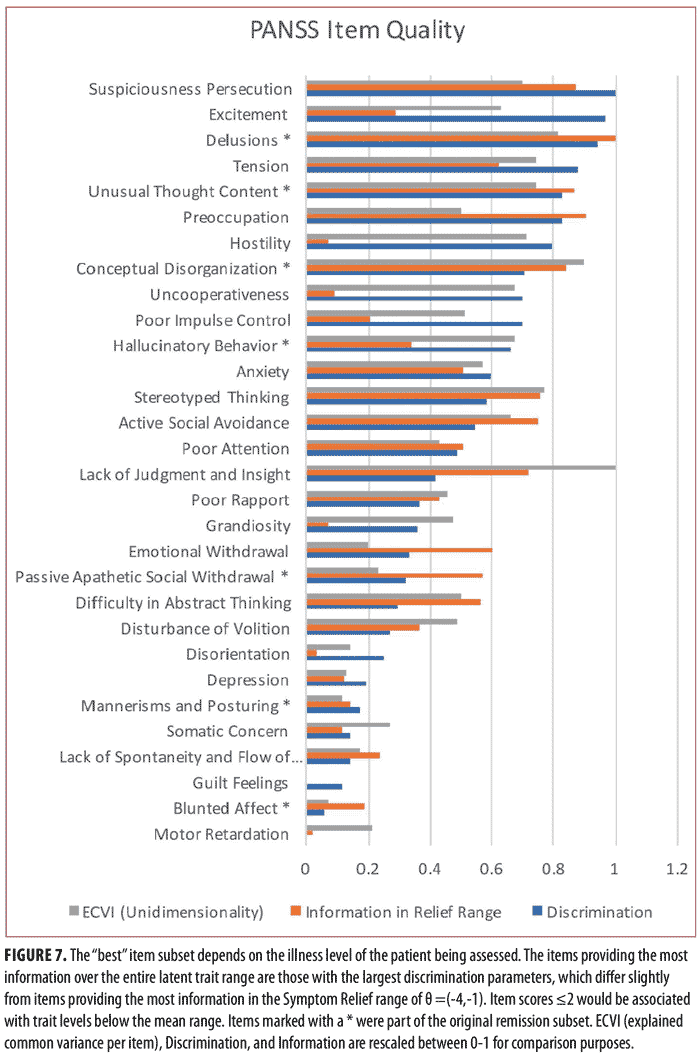
As shown in Figure 7, the best items to be used for assessment ultimately depend on the symptom severity level, as different items have different utility depending on the illness level of the patient. The items with the most total information for the entire symptom range were those with the largest discrimination parameters: Suspiciousness Persecution, Excitement, Delusions, Tension, Unusual Thought Content, Preoccupation, Hostility, and Conceptual Disorganization. Unusual Thought Content, Conceptual Disorganization, and Delusions were both part of the original Remission criteria. The items providing the most information for patients within the Relief range were calculated using the item characteristic curves. These items were Delusions, Preoccupation, Suspiciousness Persecution, Unusual Thought Content, Conceptual Disorganization, Stereotyped Thinking, Active Social Avoidance, and Lack of Judgment and Insight. Three of these items, Delusions, Unusual Thought Content, and Conceptual Organization, were contained in the original Remission criteria. Lower scores on these items (less than or equal to 2) were strongly associated with having a low latent trait theta or attaining overall “Symptom Relief.”
Limitations. There are several limitations to our models. First, we treated active and placebo interventions identically, although, previously, changes had been seen between these interventions with IRT models.9 Second, patients with reduced symptom severity post-treatment are not necessarily those who are the greatest treatment responders. Third, our models and the Relief criteria proposed here are specific to those enrolled in a drug trial; this might be different than those patients seen clinically and those for whom the original Remission criteria were established. These analyses do not suggest that the Remission criteria do not demarcate those with “an improvement in core signs and symptoms to the extent that any remaining symptoms are of such low intensity that they no longer interfere significantly with behavior and are below the threshold typically utilized in justifying an initial diagnosis of schizophrenia” as originally intended. The core signs were clinically determined for Remission based on their relevance to the disorder and their impact on patients; the IRT analyses is blind to the qualitative impact of symptoms on patients and their life outcomes.
Finally, there are also several technical concerns that we need to raise, but do not have space to fully discuss. First, we needed to run the model for a large number of iterations in order to meet the convergence criterion in mirt, possibly the sign of an unstable model. Second, in the bifactor model, the Delusions item tended toward a Heywood case—very high discrimination—that might be affecting other item parameter estimates. Third, the results of the factor analysis (limited information estimation) did not always align perfectly with the result of the IRT analysis (full information estimation). Although we did not expect perfect alignment, interpretation of item quality differed somewhat between solutions, which is potentially another sign of instability. Finally, we note again that some items had cross-loadings in violation of the bifactor model, and the overall fit was modest.
Conclusion
The Remission criteria were drafted based on clinical expertise and grounded in the Diagnostic and Statistical Manual of Mental Disorders (DSM), Fourth Edition. Our results suggest that the subjects attaining “Symptom Relief” measured using the entire PANSS scale are not necessarily Remitted, and those subjects who attain Remission frequently have latent trait scores that suggest moderate-to-severe overall symptom levels. More generally, this disparity between Remission and the latent illness level suggests that the PANSS differentially assesses patients compared to an expert clinician. The term “Symptom Relief” is presented here not just as a description of the symptom range we are profiling, but also to delineate these analyses and these results from Remission. The differences between the Relief and Remission subsets do not suggest that the Relief subset replaces, refutes, or contradicts the original Remission criteria, because the Relief items are selected to answer a different question than the Remission objectives; the Relief criteria provide a method of identifying patients with low general illness severity after the conclusion of a trial, when measured using the entire PANSS.
The original Remission criteria were linked to what was considered “active illness” in the DSM, and were considered definitional for schizophrenia and the DSM subtype of “schizophrenia in remission.” The findings reported here suggest that A) the PANSS has a strong general factor reflecting overall severity and once this is accounted for there is little additional variation in symptoms and B) satisfying the proposed criteria for Remission is not necessarily associated with low levels of general symptom severity. Together these findings call into question whether rules established to determine satisfaction of the diagnostic criteria (specifically the “A” criteria of the DSM) are truly the best way to characterize whether individuals are still in an “active illness” or have recovered well from an episode illness. While conceptually appealing, there might be value in basing definitions of “remission” or “relief” on our best estimates of general symptom severity. In constructing our criteria for symptom “relief” here, we used a direct measure of the general factor (theta is less than or equal to 1) based on IRT that identifies individuals who, on average, have symptom severity in the “absent” to “minimal” range. This approach more clearly identifies patients with lower severity of symptoms; it remains an empirical question whether application of similar criteria might be more useful clinically, or in clinical trials.
Here, the items with the greatest discrimination parameters over the entire illness range overlap considerably, but not perfectly, with the Relief criteria symptoms. This suggests that the utility of any subset of PANSS items ultimately depends on the population being evaluated. It is likely that the symptoms demarcating Relief post-treatment might differ during a different study phase or in an unmedicated patient group. Because of this, comparison of relative scores using IRT methods might permit better identification of the “moderately well” patients.
In conclusion, a reduced symptom burden is neither necessary nor sufficient for Remission following the AWG/SWG criteria. Subjects with symptom Relief post-treatment are not the same as those who meet Remission criteria, and those who did meet Remission criteria frequently overlapped in symptom severity with those who were not considered Remitted. This does not suggest that the Remission criteria do not successfully identify a subset of patients for whom “the disease burden was substantially lessened” as originally intended; the construction of these criteria based on the diagnostic criteria rather than empirical analyses might capture elements of the diagnostic system that are clinically relevant and affect aspects of patient’s well-being that are not as well addressed by general severity of symptoms. The discrepancies between these two methods—with Remission criteria focused on DSM-defined diagnostic classification and with Relief criteria focused on the general severity of symptoms as measured on the PANSS—point out the need for future empirical research to determine the advantages of each strategy.
Acknowledgments
The authors thank the study volunteers for participating in the research studies and the clinicians and support staff for enabling patient recruitment and clinical data collection. The authors also thank Adam Savitz, Giacomo Salvadore, Larry Alphs, Dong Jing Fu, Qingqin Li, Ibrahim Turkoz, Monique Franc, Anthony Santos, Nicole Bottrel, William Cafferty, and other staff in the Neuroscience Biomarkers of Janssen Research & Development for scientific input and operational support including anonymization of clinical data.
References
- Kay SR, Fiszbein A, Opfer LA. The positive and negative syndrome scale (PANSS) for schizophrenia. Schizophr Bull. 1987;13:261.
- Andreasen NC, Carpenter Jr WT, Kane JM, Lasser RA, Marder SR, Weinberger DR. Remission in schizophrenia: proposed criteria and rationale for consensus. Am J of Psychiatry. 2005;162:441–449.
- Khan A, Lewis C, Lindenmayer J-P. Use of non-Parametric Item Response Theory to develop a shortened version of the Positive and Negative Syndrome Scale (PANSS). BMC Psychiatry. 2011;11:178.
- Santor DA, Ascher-Svanum H, Lindenmayer J-P, Obenchain RL. Item response analysis of the Positive and Negative Syndrome Scale. BMC Psychiatry. 2007;7:66.
- Levine SZ, Rabinowitz J, Rizopoulos D. Recommendations to improve the Positive and Negative Syndrome Scale (PANSS) based on item response theory. Psychiatry Res. 2011;188: 446–52.
- Khan A, Lindenmayer J-P, Opler M, et al. A new Integrated Negative Symptom structure of the Positive and Negative Syndrome Scale (PANSS) in schizophrenia using item response analysis. Schizophrenia Res. 2013;150:185–196.
- Khan A, Yavorsky C, Liechti S, et al. A Rasch model to test the cross-cultural validity in the Positive and Negative Syndrome Scale (PANSS) across six geo-cultural groups. BMC Psychiatry. 2013;1:5.
- Khan A, Lindenmayer JP, Opler M, et al. The evolution of illness phases in schizophrenia: a non-parametric item response analysis of the Positive and Negative Syndrome Scale. Schizophr Res: Cognition. 2014;1:53–89.
- Krekels EH, Novakovic AM, Vermeulen AM, et al. Item response theory to quantify longitudinal placebo and paliperidone effects on PANSS scores in schizophrenia. CPT Pharmacometrics Syst Pharmacol. 2017 Aug;6(8):543-551.
- Anderson A, Wilcox M, Savitz A, et al. Sparse factors for the positive and negative syndrome scale: Which symptoms and stage of illness? Psychiatry Res. 2015;225:283–290.
- Anderson AE, Mansolf M, Reise SP, et al. Measuring pathology using the PANSS across diagnoses: inconsistency of the positive symptom domain across schizophrenia, schizoaffective, and bipolar disorder. Psychiatry Res. 2017;258:207–216.
- van der Gaag M, Cuijpers A, Hoffman T, et al. The five-factor model of the Positive and Negative Syndrome Scale I: confirmatory factor analysis fails to confirm 25 published five-factor solutions. Schizophr Res. 2006;85:273–279.
- Cai L, Yang JS, Hansen M. Generalized full-information item bifactor analysis. Psychol Methods. 2011;16:221.
- Edelen MO, Reeve BB. Applying item response theory (IRT) modeling to questionnaire development, evaluation, and refinement. Qual Life Res. 2007;16:5–18.
- Reise SP. The rediscovery of bifactor measurement models. Multivariate Behav Res. 2012;47:667–696.
- Stucky BD, Thissen D, Orlando Edelen M. Using logistic approximations of marginal trace lines to develop short assessments. Applied Psychological Measurement. 2013;37:41-57.
- Embretson SE, Reise SP. Item Response Theory for Psychologists. London, UK: Psychology Press; 2000.
- Samejima F. Graded response model. In: Handbook of Modern Item Response Theory. van der Linden WJ, Hambleton RK (eds). New York, NY: Springer;1997:85–100.
- Vieta E, Nuamah IF, Lim P, et al. A randomized, placebo-and active-controlled study of paliperidone extended release for the treatment of acute manic and mixed episodes of bipolar I disorder. Bipolar Disorders. 2010;12:230–243.
- Berwaerts J, Lane R, Nuamah IF, et al. Paliperidone extended-release as adjunctive therapy to lithium or valproate in the treatment of acute mania: a randomized, placebo-controlled study. J Affect Disord. 2011;129:252–260.
- Canuso CM, Schooler N, Carothers J, et al. Paliperidone extended-release in schizoaffective disorder: a randomized, controlled study comparing a flexible dose with placebo in patients treated with and without antidepressants and/or mood stabilizers. J Clinical Psychopharmacol. 2010;30:487–495.
- Kramer M, Simpson G, Maciulis V, et al. Paliperidone extended-release tablets for prevention of symptom recurrence in patients with schizophrenia: a randomized, double-blind, placebo-controlled study. J Clinical Psychopharmacol. 2007;27:6–14.
- Canuso C, Dirks B, Carothers J, et al. Randomized, double-blind, placebo-controlled study of paliperidone extended-release and quetiapine in inpatients with recently exacerbated schizophrenia. Am J Psychiatry. 2009;166: 691–701.
- Tzimos A, Samokhvalov V, Kramer M, et al. Safety and tolerability of oral paliperidone extended-release tablets in elderly patients with schizophrenia: a double-blind, placebo-controlled study with six-month open-label extension. Am J of Geriatr Psych. 2008;16:31–43.
- Meltzer HY, Bobo WV, Nuamah IF, et al. Efficacy and tolerability of oral paliperidone extended-release tablets in the treatment of acute schizophrenia: pooled data from three 6-week, placebo-controlled studies. J Clin Psychiatry. 2008;69:817–829.
- Davidson M, Emsley R, Kramer M, et al. Efficacy, safety and early response of paliperidone extended-release tablets (paliperidone ER): results of a 6-week, randomized, placebo-controlled study. Schizophr Res. 2007;93:117–130.
- Gopal S, Hough DW, Xu H, et al. Efficacy and safety of paliperidone palmitate in adult patients with acutely symptomatic schizophrenia: a randomized, double-blind, placebo-controlled, dose-response study. Int Clin Psychopharmacol. 2010;25:247–256.
- Bossie C, Sliwa J, Ma Y-W, et al. Onset of efficacy and tolerability following the initiation dosing of long-acting paliperidone palmitate: post-hoc analyses of a randomized, double-blind clinical trial. BMC Psychiatry. 2011;11:79.
- Kramer M, Litman R, Hough D, et al. Paliperidone palmitate, a potential long-acting treatment for patients with schizophrenia: results of a randomized, double-blind, placebo-controlled efficacy and safety study. Int J Neuropsychopharmacol. 2010;13:635.
- Mansolf M, Reise SP. Exploratory bifactor analysis: the Schmid-Leiman orthogonalization and Jennrich-Bentler analytic rotations. Multivariate Behavioral Res. 2016;51:698–717.
- Revelle W. psych: Procedures for Personality and Psychological Research, Northwestern University, Evanston, Illinois, USA. https://CRAN.R-project.org/package=psych Version = 1.7.8. Accessed December 1, 2017.
- Yves Rosseel. lavaan: An R package for structural equation modeling. J Statistical Software. 2012;48(2):1-36. http://www.jstatsoft.org/v48/i02/.
- Zinbarg RE, Revelle W, Yovel I, Li W. Cronbach’s alpha, Revelle’s beta, and McDonald’s omegaH: their relations with each other and two alternative conceptualizations of reliability. 2005;70:123–133.
- Chalmers RP. mirt: a multidimensional item response theory package for the R environment. J Statistical Software. 2012;48:1–29.
- Toland MD, Sulis I, Giambona F, et al. Introduction to bifactor polytomous item response theory analysis. J School Psychol. 2017;60:41–63.
- Bock RD, Mislevy RJ. Adaptive EAP estimation of ability in a microcomputer environment. Appl Psychol Meas. 1982;6:431-44.
- Inman HF, Bradley Jr EL. The overlapping coefficient as a measure of agreement between probability distributions and point estimation of the overlap of two normal densities. Communications in Statistics-Theory and Methods. 1989;18:3851–3874.
- Edelen MO, Stucky BD, Chandra A. Quantifying “problematic” DIF within an IRT framework: Application to a cancer stigma index. Qual of Life Res. 2015;24:95–103.


