 by Akihide Wakamatsu, Kazuo Aoki, Yojiro Sakiyama, Takashi Ohnishi, and Makoto Sugita
All from the CNS Department, Scientific Affairs Division, Janssen Pharmaceutical K.K., Tokyo Japan
Innov Clin Neurosci. 2013;10(3):23–30
Funding: Funding was provided by Janssen Pharmaceuticals K.K., Tokyo, Japan.
Financial Disclosures: All authors are employee of Janssen Pharmaceutical K.K.
Key Words: Atypical antipsychotics, pharmacokinetics, fluctuation index, one-compartment simulation
Abstract: Lower fluctuation, i.e., lower peak-to-trough plasma-concentration variation at steady-state pharmacokinetics, has several advantages for the treatment of schizophrenia with antipsychotics. The reduction of peak concentration can decrease the risk of dose-dependent side effects, such as extrapyramidal symptom and somnolence, and by contrast the increase in trough concentration can decrease the incidence of lack of efficacy due to subtherapeutic drug concentration. Using a one-compartment simulation technique with pharmacokinetic parameters of each atypical antipsychotic collected from package inserts, the fluctuation index was calculated. Among the antipsychotics, the indices varied from 0.018 to 1.9, depending on dosing regimens, formulations and several pharmacokinetic properties. The order of simulated fluctuation index is active-moiety aripiprazole (b.i.d.) <paliperidone extended release (q.d.) <active-moiety aripiprazole (q.d.) <active-moiety blonanserin (b.i.d.) <olanzapine (q.d.) <active-moiety risperidone (b.i.d.) <amisulpride (q.d.) <active-moiety risperidone (q.d.) <quetiapine (t.i.d.) <perospirone (t.i.d.) <quetiapine (b.i.d.). Since the fluctuation indices of aripiprazole and paliperidone extended-release are less than 0.2, which predominantly attributed to their long elimination half-lives, aripiprazole and paliperidone extended-release may have advantages in that the plasma concentration could be kept within appropriate therapeutic range.
Introduction
Maintaining plasma drug concentration within an appropriate therapeutic range is a very critical issue for pharmacotherapy in patients. Various dosing regimens and formulations have been devised for continuous drug therapy in psychiatric areas, such as mania, depression, and schizophrenia. Looking at another perspective, preventing relapse is also very important for patients to maintain social functioning.[1] Most of all, the continuity of pharmacotherapy with antipsychotics is necessary for patients with schizophrenia to prevent relapse.[2] Since the side effects of antipsychotics may play a major role in determining adherence,[3–5] the lower fluctuation can also have a potential to improve medication adherence in schizophrenia treatment with antipsychotics. In addition, most patients prefer an oral drug, thus many pharmaceutical industries have been struggling to develop high-performance formulations of oral atypical antipsychotics designed to improve adherence. One of the unique formulations is a paliperidone extended-release (ER). The paliperidone ER utilizes the osmotic controlled-release oral delivery system (OROS) in order to release paliperidone with osmotic pump over a 24-hour period, to exhibit a slowly ascending concentration-time profile, and to achieve smaller fluctuation in plasma concentration.[6] Paliperidone is an active metabolite of risperidone and has almost the same receptor-binding profile as risperidone, antagonistically targeting serotonin 5-HT2A and dopamine D2 receptors.[7] Therefore, compared to risperidone, paliperidone ER is expected to have the equivalent efficacy and an improved safety profile. Quetiapine extended-release (XR) also shows a slower ascending/descending profile of plasma concentration compared to quetiapine immediate-release, although the release rate is not well-controlled.[8] Paliperidone ER and quetiapine XR are the only two extended-release formulations currently available. All the other formulations are immediate release.
Psychiatrists must choose a drug that is thought to be optimal for each individual patient, thus some measures or indicators that help to choose among the drugs could be useful in the general clinical settings. The optimal use of oral antipsychotics should be taken into account in terms of its efficacy and safety profile.
Pharmacological aspects of antipsychotics have been investigated by various studies, such as comparison with affinity for receptors,[9–11] although the clinical relevance of peak-to-trough ratios and subsequent pharmacological mechanisms remain controversial.[12–14] Therapeutically effective plasma concentrations can, in some cases, be mathematically predicted through the relationship between the pharmacokinetic (PK) and pharmacodynamic (PD) properties of the drugs. The modeling of time-plasma concentration and time-response data, so called PK/PD modeling, can contribute to the design of rational dosage regimens in clinical pharmacology. The PK/PD modeling has been applied to predict PD outcomes at steady-state, such as dopamine D2 receptor occupancy and suppression of conditioned avoidance response.[13,15–17] The human D2 receptor occupancy measured by positron emission tomography (PET) can be well predicted from the antipsychotic plasma level in patients with schizophrenia, using a one-site binding Emax model. Several antipsychotics, such as risperidone and olanzapine, showed good correlation of the plasma concentration with the actual D2 occupancy in the PET studies.[17,18] Based on these results, we hypothesized that if peak-to-trough plasma concentration (PK fluctuation) of antipsychotics at steady state can be maintained within a certain therapeutic range, their PD can also be maintained within an appropriate range in order to keep efficacy and avoid side effects. The PK fluctuation can be measured by exposure parameters at steady-states. Several reports have described the steady-state exposure parameters measured by direct blood sampling.[19,20] These reports, however, are different for each patient population background, thus direct comparison would be difficult without applying a meta-analytic exploration. The direct comparison of PK fluctuation between all antipsychotics by blood sampling in a randomized, controlled study has not been reported and would be quite resource-intensive.
Under such circumstances, the most convenient way to compare and to assess them would be to simulate the PK fluctuation using the existing PK parameters of each oral atypical antipsychotic. The exposure parameters at steady state can be estimated by applying a first order absorption one-compartment model. The model is quite robust and most widely used. The vulnerability by the effect of active metabolite fraction could be resolved by assessing the total active moiety of the drugs, with sensitivity analysis changing relative equivalence of active fraction within various ranges.
Here we present the data examining the PK fluctuation of various antipsychotics in a comparative manner using the convenient simulation technique, with an expectation to be useful as a measure for seeking an optimal dosing regimen.
Materials and Methods
Atypical antipsychotics. Within the last few years, a number of antipsychotics have been used in the treatment for patients with schizophrenia. Here we examined amisulpride, aripiprazole, blonanserin, olanzapine, paliperidone ER, perospirone hydrochloride, quetiapine fumarate, and risperidone—all of which are used as first-line drugs for patients with schizophrenia.
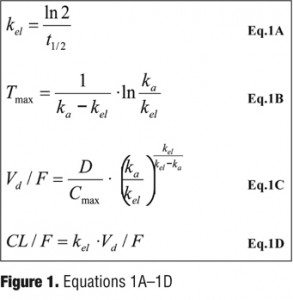
Pharmacokinetic parameters. Pharmacokinetic parameters of the atypical antipsychotics were calculated with the use of existing parameters, the elimination half-life (t1/2), time to peak concentration (Tmax), peak concentration (Cmax) and D (dose) as described in the published literature21 and/or package inserts.[22–28] Using a one-compartment model, the single-dose absorption rate constant (ka), the elimination rate constant (kel), the apparent volume of distribution (Vd/F), and the apparent clearance (CL/F) were calculated, where F is the fraction of an oral dose that reaches the systemic circulation (bioavailability). If the PK parameters of each drug were obtained from different studies involving various dosages, these parameters were arithmetically averaged to use for estimates. The parameters were estimated by using the equations in Figure 1.
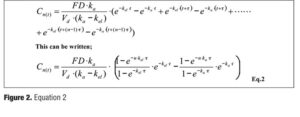
Pharmacokinetic parameters with multiple oral administration. When drugs are orally administered in a repeated manner with a fixed dosing interval tau, plasma drug concentration at t hours after the nth dose can be expressed in the same manner as described in several textbooks by the equations in Figure 2.[29,30]
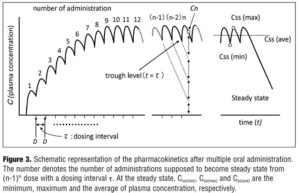
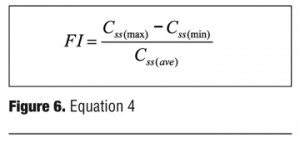
Based on this equation, the plasma concentration-time curve under multiple oral administrations can be illustrated as Figure 3, provided that the plasma concentration progressively reaches steady state as the number of administration increases. The plasma concentration at steady state (Css), the time to maximum plasma concentration at steady state (tss(max)), the maximum plasma concentration at steady state (Css(max)) can be expressed as in Figure 4 where Css(min) is a trough level.

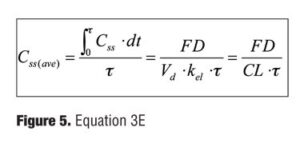
In addition, Css(ave), the mean plasma concentration at steady state, can be written as in Figure 5.
To calculate parameters, Eq.1 (Figure 1) is used for data of single dosing trials and Eq.2 (Figure 2) is for data of multiple dosing trials. The parameters were finally obtained as the mean of all the individual parameters calculated from clinical trials associated with each test drug. The plasma concentration (Css(t)) at the time, t, at steady state was estimated by Eq.2 (Figure 2). The maximum, minimum, and mean values of Css(t) were estimated as Css(max), Css(min), and Css(ave) by Eq.3A–E (Figure 4).
Fluctuation index. Several methods have been reported to assess peak-to-trough plasma-concentration variation, i.e. fluctuation index (FI). One of the convenient methods is to calculate the ratio of the steady-state maximum plasma concentration Css(max) to the steady-state minimum plasma concentration Css(min).[31] The simple ratio (Css(min)/Css(max)) is adequate in that accuracy is ensured only when the denominator (Css(max)) is large enough. In order to obtain accurate FI value with an appropriate S/N ratio, our study here applies the equation taking into account of the mean plasma concentration Css(ave) as described in Figure 6.[32–34]
Analysis of active moiety (taking into account of active fractions). With regard to aripiprazole, blonanserin, and risperidone, their active metabolite (OPC-14857, M-1 and 9-hydroxy risperidone) should be taken into account. The metabolite is assumed to be administered simultaneously with the unmetabolized fraction as a matter of convenience. The concentration of total active moiety was estimated by the concentration of mother drug plus the concentration of metabolized fraction converted by the ratio of their molecular weights (OPC-14857; 446.39, 9-hydroxy risperidone; 426.48, M-1; 339.50), with an assumption that pharmacological activity of the active fraction is equal to the mother drug, i.e. the relative equivalence is 1.
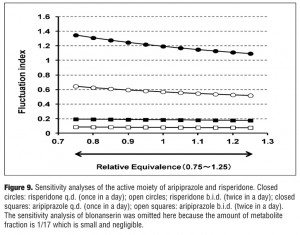
Sensitivity analysis. The effect of reactive metabolites was investigated by the sensitivity analysis to confirm the contribution of reactive metabolite by changing its relative equivalence against the mother drug. With regard to aripiprazole and risperidone, the equivalence of metabolite is 1, hence the relative equivalence was changed from 0.75 to 1.25. With regard to blonanserin, the equivalence of metabolite is 1/17, hence the relative equivalence was changed from 1/25 to 1/10.
Validation of simulating FI and exposure parameters. To assess the validity of simulating FI by a one-compartment model, we compared the measured and simulated FI value using data of 23 Japanese patients with schizophrenia in risperidone and paliperidone ER Phase II studies. The FI values were simulated using the compartment model, with t1/2 and CL obtained from individual patients. In parallel, predicted exposure parameters at steady-state (Css(min), Css(max)) was obtained by the model, and compared with the measured ones.
Statistics. The overall statistical analyses in the present study, including a compartment model analysis, were conducted with the SAS analysis package (version 9.0, SAS Institute Inc., Cary, North Carolina). The Pearson’s correlation coefficient was calculated using the JMP analysis package (version 9.0, SAS Institute Inc., Cary, North Carolina).
Results
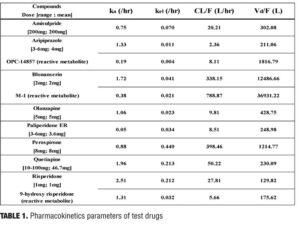
Pharmacokinetics at steady state. The parameters, ka, kel, CL/F and Vd/F of each drug, were calculated using the common core parameters, such as Tmax, Cmax, and t1/2 obtained from published literature (Table 1). The data of multiple dosing with paliperidone ER was excluded, since the ka could not be estimated due to dispersion by the Newton method.
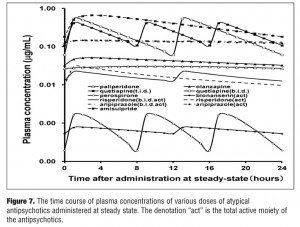
The time-plasma concentration curves of each drug at steady state after dosing is shown in Figure 7.
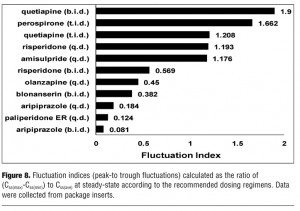
Fluctuation indices. The results of the fluctuation index of each atypical antipsychotic are summarized in Figure 8. The rank order of the fluctuation indices is active-moiety aripiprazole (6mg/day, b.i.d.) <paliperidone ER (6mg/day, q.d.) <active-moiety aripiprazole (6mg/day, q.d.) <active-moiety blonanserin (8mg/day, b.i.d) <olanzapine (10mg/day, q.d.) <active-moiety risperidone (2mg/day, b.i.d.) <amisulpride (200mg/day, q.d.) <active-moiety risperidone (2mg/day, q.d.) <quetiapine (300mg/day, t.i.d.) <perospirone (12mg/day, t.i.d.) <quetiapine (300mg/day, b.i.d.). In the case that FI of risperidone (b.i.d.) is set at 1, the relative FI ratios to other drugs are following; active-moiety aripiprazole(b.i.d.) 0.14, paliperidone ER 0.22, active-moiety aripiprazole (q.d.) 0.32, active-moiety blonanserin 0.67, olanzapine 0.79, amisulpride(q.d.) 2.07, active-moiety risperidone (q.d.) 2.10, quetiapine(t.i.d.) 2.12, perospirone 2.92 and quetiapine(b.i.d.) 3.34. To examine which parameter most contributes to FI, we evaluate the correlation between FI and ka and between FI and t1/2, based on the results of Table 1 (aripiprazole, blonanserin, and risperidone are excluded because each of them has reactive metabolite). Pearson’s correlation coefficients between FI and ka and between FI and t1/2 are 0.55 (p=0.4464) and -0.86 (p=0.1397), respectively.
Sensitivity analysis. The results of the sensitivity analysis are shown in Figure 9. In the case of aripiprazole and risperidone, the equivalence was supposed to be 1 with relative equivalence varied from 0.75 to 1.25, whereas in the case of blonanserin the equivalence was supposed to be 1/17 with relative equivalence varied from 1/25 to 1/10. The range of FI of aripiprazole (b.i.d.), aripiprazole (q.d.), risperidone (b.i.d.), and risperidone (q.d.) varied from 0.077 to 0.086, 0.176 to 0.194, 0.519 to 0.645, and 1.094 to 1.347, respectively. When the relative equivalence of blonanserin varied from 1/25 to 1/10 along with its data on the package insert, the range of FI varied from 0.374 to 0.386 (omitted in the Figure 9 because the range was quite small).
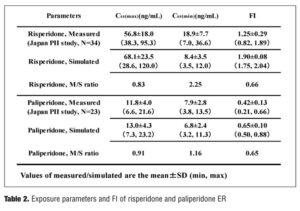
Validation of exposure parameters and FI of paliperidone ER. The measured and simulated exposure parameters (Css(min), Css(max)) and FI of risperidone and paliperidone ER are compared and summarized in Table 2.
Conclusion
The purpose of this study is to simulate and predict the pharmacokinetic plasma fluctuation in a comparative manner, following multiple oral administrations with various atypical antipsychotics used as the first-line drug in patients with schizophrenia. The results have demonstrated with the following rank order of simulated PK fluctuation: active-moiety aripiprazole (b.i.d.) <paliperidone ER (q.d.) <active-moiety aripiprazole (q.d.) <active-moiety blonanserin (b.i.d.) <olanzapine (q.d.) <active-moiety risperidone (b.i.d) <amisulpride (q.d.) <active-moiety risperidone (q.d.) <quetiapine (t.i.d.) <perospirone (t.i.d.) <quetiapine (b.i.d.). Active-moiety aripiprazole and paliperidone ER showed the most stable pharmacokinetics among the tested drugs. The drug that has the most distinct feature among the tested drugs is aripiprazole, which is a partial agonist, not antagonist, of the D2 receptor with high affinity.[35] The appropriate efficacy of aripiprazole can be expected when aripiprazole binds to D2 receptors on the cell surface in a full range.[36] Therefore, stable pharmacokinetics within the therapeutic window is not necessarily required in the case of aripiprazole. On the other hand, paliperidone as well as risperidone completely block serotonin 5-HT2A and D2 receptors.[7] Therefore, compared to aripiprazole, paliperidone ER is expected to show stable efficacy and lower side effects by its stable pharmacokinetics within the appropriate therapeutic window. The FI value of olanzapine was 0.45, whereas that of quetiapine was 1.9 (b.i.d.), although both are classified as the multi-acting receptor targeted antipsychotics.[37] The difference could be due to the difference in the rate of elimination (olanzapine: kel=0.02, quetiapine: kel=0.21) rather than the difference in pharmacological profiles.
Whether part of PK parameters (ka, t1/2) affects FI or not was investigated by correlation analysis, although the correlations between them was not significant due in part to the small sample size. However, in terms of aripiprazole with the smallest FI (0.081), the mother compound has a long t1/2 (61.3 hr), and its active metabolite (OPC-14857) has an extremely long t1/2 (279 hr) and a very small ka (0.185). On the contrary, perospirone provide a relatively large FI (1.662), presumably due to its short t1/2 (2.3 hr) and large ka (0.880). These results suggest that smaller ka and longer t1/2 could contribute to the pharmacokinetic stability of these drugs. The results also suggest that the larger number of administrations per day could also contribute to the fluctuation (e.g. aripiprazole b.i.d. shows lower FI value, 0.081, than the aripiprazole q.d., 0.184). The results have also met our expectation that ka of paliperidone ER was quite small (0.053) compared to that of 9-hydoroxy risperidone (1.309), although these t1/2 are almost the same (obviously as these are the same compounds). The smaller ka of paliperidone ER just reflects the controlled release of 9-hydoroxy risperidone by the OROS system. The results in part corresponded to the previous comparative study which assessed the fluctuation by direct ratio of Css(max)/Css(min) and had paliperidone ER <olanzapine <risperidone.[31] These results also suggested that ka and t1/2 could be the most predictive factors of stable pharmacokinetics.
To take into account the effect of active metabolites, the sensitivity analysis was implemented by changing the relative equivalence from 75 percent to 125 percent. The results in Figure 9 show that the largest FI variation was observed in the case of risperidone (q.d.) which changed the value of FI from 1.09 to 1.35, indicating that the effect of the active fraction on FI could be small enough, at least less than 30 percebt of the basal FI values. Furthermore, the influence of varying the range of relative equivalence has no effect on the rank order of lower FI group (less than 1).
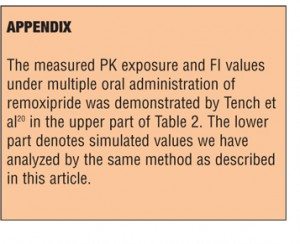
The simulated exposure parameters and FI of each drug were validated by comparison with measured values using the results of the small number of Japanese Phase II studies, including two studies with the use of risperidone and paliperidone ER.[38] The results are summarized in Table 2, which demonstrates both the same tendencies that the measured Css(max) were lower than the simulated ones, whereas the measured Css(min) was higher than the simulated ones, and the measured FI was lower (approximately 65%) than the simulated ones. The overall SD values of the measured parameters were overall higher than the simulated ones, presumably because the measured exposure parameter depends on the blood sampling intervals. The real peak values of Css(max) can be measured directly by the use of frequent blood sampling (e.g. 1 min of sampling interval), although the methods would not be practical. On the other hand, first order absorption and dissociation of the oral administration can be described with almost the same pattern by using a one-compartment model which is robust but in some cases difficult to estimate the sharp peak. Although the simulation techniques possess several drawbacks, Table 2 suggests that the ratio of the measured/simulated values are almost the same between risperidone and paliperidone ER, that is, the gap of measured/simulated data, seems to be independent of the kind of drugs. We also tried to simulate FI of remoxipride immediate release by the same method, and the predicted FI value was 0.823 which was quite close to the reported measured FI, 0.81 (see Appendix).[20] The results have suggested that the first order absorption one-compartment model could be robust and useful to assess PK fluctuation of each antipsychotic, at least to assess by the rank order level.
The result of lower fluctuation of paliperidone ER and aripiprazole demonstrated here can serve as a rationale for their safe use of them. The newer atypical agents are suggested to increase adherence, primarily because patients might find the side effects more acceptable than the side effect profiles of the conventional agents (e.g., extrapyramidal side effects).[39–41] However, atypical agents are not free of side effects (e.g., postural hypotension, sedation, anticholinergic side effects, weight gain).[42] Therefore, a certain measure that can be a guide to choose safer one among atypicals is still required.
Assessment and control of fluctuation in plasma concentration is clinically important in various aspects. Especially when targeting to a small therapeutic window, control of fluctuation within the therapeutic window is important to maintain efficacy and to avoid side effects. Based on this concept, pharmaceutical industries have been struggling to develop controlled-release drugs. Paliperidone ER is one of such drugs with the aim to control plasma concentration within appropriate level. A recent pooled analysis has shown the presence of a therapeutic window of 60 to 78 percent D2 occupancy of antipsychotics in young adults with schizophrenia.[18] When targeting on the therapeutic window, paliperidone ER has an advantage over risperidone tablet.[43] The controlled-release strategy has also been conducted in the area of epilepsy. Most anti-epileptic drugs (AEDs) have a small therapeutic window so plasma concentration should be strictly controlled, where extended release formulation of AEDs play an important role for seizure control, patient preference, adherence, and improved tolerability.[44] The antipsychotic effect of atypicals and its relation to plasma levels was not the aim in the present study, but the results of the present study could form a basis for further investigations into the relation between plasma fluctuations and its clinical relevance.
The results demonstrated here can also serve as a guide for the actual management of schizophrenia, by which clinicians can develop a regimen to optimize the number and the amount of daily drug doses. In addition, it can help clinicians to choose between various antipsychotics, which could be beneficial in general clinical settings.
References
1. Lieberman JA, Perkins D, Belger A et al. The early stages of schizophrenia: speculations on pathogenesis, pathophysiology, and therapeutic approaches. Biol Psychiatry. 2001:50(11):884–897.
2. Kane JM. Schizophrenia. N Engl J Med. 1996:334(1):34–41.
3. Buchanan A. A two-year prospective study of treatment compliance in patients with schizophrenia. Psychol Med. 1992:22(03):787–797.
4. Fenton WS, Blyler CR, Heinssen RK. Determinants of medication compliance in schizophrenia: empirical and clinical findings. Schizophr Bull. 1997:23(4):637–651.
5. Van Putten T. Why do schizophrenic patients refuse to take their drugs? Arch Gen Psychiatry. 1974:31(1):67–72.
6. Conley R, Gupta SK, Sathyan G. Clinical spectrum of the osmotic-controlled release oral delivery system (OROS), an advanced oral delivery form. Curr Med Res Opin. 2006:22(10):1879–1892.
7. Gray JA, Roth BL. The pipeline and future of drug development in schizophrenia. Mol Psychiatry. 2007:12(10):904–922.
8. Figueroa C, Brecher M, Hamer-Maansson JE,et al. Pharmacokinetic profiles of extended release quetiapine fumarate compared with quetiapine immediate release. Prog Neuro-Psychopharmacol Biol Psychiatry. 2009:33(2):199–204.
9. Bishara D, Taylor D. Upcoming agents for the treatment of schizophrenia: mechanism of action, efficacy and tolerability. Drugs. 2008:68(16):2269–2292.
10. Kapur S, Seeman P. Does fast dissociation from the dopamine d(2) receptor explain the action of atypical antipsychotics? a new hypothesis. Am J Psychiatry. 2001:158(3):360–369.
11. Seeman P. Atypical antipsychotics: mechanism of action. Can J Psychiatry. 2002:47(1):27–38.
12. Ereshefsky L, Mascarenas CA. Comparison of the effects of different routes of antipsychotic administration on pharmacokinetics and pharmacodynamics. J Clin Psychiatry. 2003:64 Suppl 16:18–23.
13. Medori R, Mannaert E, Grunder G. Plasma antipsychotic concentration and receptor occupancy, with special focus on risperidone long-acting injectable. Eur Neuropsychopharmacol. 2006:16(4):233–240.
14. Nazirizadeh Y, Vogel F, Bader W, et al. Serum concentrations of paliperidone versus risperidone and clinical effects. Eur J Clin Pharmacol. 2010:66(8):797–803.
15. Ma G, Friberg LE, Movin-Osswald G, et al. Comparison of the agonist-antagonist interaction model and the pool model for the effect of remoxipride on prolactin. Br J Clin Pharmacol. 2010:70(6):815–824.
16. Olsen CK, Brennum LT, Kreilgaard M. Using pharmacokinetic-pharmacodynamic modelling as a tool for prediction of therapeutic effective plasma levels of antipsychotics. Eur J Pharmacol. 2008:584(2-3):318–327.
17. Uchida H, Takeuchi H, Graff-Guerrero A, et al. Predicting dopamine D receptor occupancy from plasma levels of antipsychotic drugs: a systematic review and pooled analysis. J Clin Psychopharmacol. 2011:31(3):318–325.
18. Uchida H, Takeuchi H, Graff-Guerrero A, et al. Dopamine D2 receptor occupancy and clinical effects: a systematic review and pooled analysis. J Clin Psychopharmacol. 2011:31(4):497–502.
19. Berwaerts J, Cleton A, Rossenu S, et al. A comparison of serum prolactin concentrations after administration of paliperidone extended-release and risperidone tablets in patients with schizophrenia. J Psychopharmacol. 2010:24(7):1011–1018.
20. Tench D, Soni SD, Ashwood T, et al. Steady-state pharmacokinetics of controlled release and immediate release formulations of remoxipride in patients with chronic schizophrenia. Psychopharmacology (Berl). 1990:101(1):132–136.
21. Gschwend MH, Arnold P, Ring J, et al. Selective and sensitive determination of amisulpride in human plasma by liquid chromatography–tandem mass spectrometry with positive electrospray ionisation and multiple reaction monitoring. J Chromatography B. 2006:831(1–2):132–139.
22. 2009. Drug information of risperidone. Interview form of RISPERRDAL® Tablets & OD Tablets & Fine Granules & Oral Solution 10th edition:http://www.janssen.co.jp.
23. 2009. Drug information of quetiapine. Interview form of SEROQUEL® Tablets & Fine Granules 10th edition:http://www.janssen.co.jp.
24. 2011. Drug information of aripiprazole. Interview form of ABILIFY® 11rd edition:http://www.otsuka.co.jp.
25. 2011. Drug information of pariperidone ER. Interview form of INVEGA® Tablets 2nd edition:http://www.janssen.co.jp.
26. 2011. Drug information of olanzapine. Interview form of ZYPREXA® 13rd edition:http://www.lillyanswers.jp.
27. 2011. Drug information of perospirone. Interview form of LULLAN® 15th edition:http://ds-pharma.jp.
28. 2011. Drug information of blonanserin. Interview form of LONASEN® 15th edition:http://ds-pharma.jp.
29. Clark B, Smith DA. An Introduction to Pharmacokineticss, Second Edition. Oxford: Blackwell Scientific; 1986.
30. Dhillon S, Kostrzewski A. Clinical Pharmacokinetics. Pharmaceutical Pr. 2006.
31. Sheehan JJ, Reilly KR, Fu DJ et al. Comparison of the peak-to-trough fluctiation in plasma concentration of long-acting injectable antipsychotics and their oral equivalents. Innov Clin Neurosci. 2012:9(7–8):17–23.
32. Eerdekens M, Van Hove I, Remmerie B et al. Pharmacokinetics and tolerability of long-acting risperidone in schizophrenia. Schizophr Res. 2004:70(1):91–100.
33. Mannaert E, Vermeulen A, Remmerie B, et al. Pharmacokinetic profile of long-acting injectable risperidone at steady-state: comparison with oral administration. Encephale. 2005:31(5 Pt 1):609–615.
34. Packer M, Lukas MA, Tenero DM, Baidoo CA, Greenberg BH et al. Pharmacokinetic profile of controlled-release carvedilol in patients with left ventricular dysfunction associated with chronic heart failure or after myocardial infarction. Am J Cardiol. 2006:98(7A):39L–45L.
35. DeLeon A, Patel NC, Lynn Crismon M. Aripiprazole: A comprehensive review of its pharmacology, clinical efficacy, and tolerability. Clin Ther. 2004:26(5):649–666.
36. Yokoi F, Gründer G, Biziere K, et al. Dopamine D2 and D3 receptor occupancy in normal humans treated with the antipsychotic drug aripiprazole (OPC 14597): a study using positron emission tomography and [11C]raclopride. Neuropsychopharmacology. 2002:27(2):248–259.
37. Schotte A, Janssen P, Gommeren W et al. Risperidone compared with new and reference antipsychotic drugs: in vitro and in vivo receptor binding. Psychopharmacology. 1996:124(1):57–73.
38. Arakawa R, Ito H, Takano A, et al. Dose-finding study of paliperidone ER based on striatal and extrastriatal dopamine D2 receptor occupancy in patients with schizophrenia. Psychopharmacology. 2008:197(2):229–235.
39. Casey DE. The relationship of pharmacology to side effects. J Clin Psychiatry. 1997:58(Suppl 10):55–62.
40. Gaebel W. Towards the improvement of compliance: the significance of psycho-education and new antipsychotic drugs. Int J Psychopharmacol. 1997:12(Suppl 1):S37–42.
41. Marder SR. Facilitating compliance with antipsychotic medication. J Clin Psychiatry. 1998:59(Suppl 3):21–25.
42. Stanniland C, Taylor D. Tolerability of atypical antipsychotics. Drug Saf. 2000:22(3):195–214.
43. Okubo Y. Positron emission tomographic analysis of paliperidone ER. Jpn J Psychiatry. 2011:19(2):152–159.
44. Werz MA. Pharmacotherapeutics of epilepsy: use of lamotrigine and expectations for lamotrigine extended release. Ther Clin Risk Manag. 2008:4(5):1035–1046.


