 by Farnaz Zamani Esfahlani, MS; Hiroki Sayama, DSc; Katherine Frost Visser, MS; and Gregory P. Strauss, PhD
Ms. Zamani Esfahlani is a PhD candidate in the Systems Science program at the State University of New York at Binghamton. Dr. Sayama is the director of the Center for Collective Dynamics of Complex Systems (CoCo), professor in the Department of Systems Science and Industrial Engineering, and director of Graduate Programs in Systems Science at the State University of New York at Binghamton. Ms. Visser is a graduate student at the State University of New York at Binghamton. Dr. Strauss is an assistant professor at the State University of New York at Binghamton.
Funding: No funding was provided for this study.
Disclosures: The authors have no conflicts of interest relevant to the content of this article.
Abstract: Objective. The Positive and Negative Syndrome Scale is a primary outcome measure in clinical trials examining the efficacy of antipsychotic medications. Although the Positive and Negative Syndrome Scale has demonstrated sensitivity as a measure of treatment change in studies using traditional univariate statistical approaches, its sensitivity to detecting network-level changes in dynamic relationships among symptoms has yet to be demonstrated using more sophisticated multivariate analyses. In the current study, we examined the sensitivity of the Positive and Negative Syndrome Scale to detecting antipsychotic treatment effects as revealed through network analysis.
Design. Participants included 1,049 individuals diagnosed with psychotic disorders from the Phase I portion of the Clinical Antipsychotic Trials of Intervention Effectiveness (CATIE) study. Of these participants, 733 were clinically determined to be treatment-responsive and 316 were found to be treatment-resistant. Item level data from the Positive and Negative Syndrome Scale were submitted to network analysis, and macroscopic, mesoscopic, and microscopic network properties were evaluated for the treatment-responsive and treatment-resistant groups at baseline and post-phase I antipsychotic treatment.
Results. Network analysis indicated that treatment-responsive patients had more densely connected symptom networks after antipsychotic treatment than did treatment-responsive patients at baseline, and that symptom centralities increased following treatment. In contrast, symptom networks of treatment-resistant patients behaved more randomly before and after treatment.
Conclusions. These results suggest that the Positive and Negative Syndrome Scale is sensitive to detecting treatment effects as revealed through network analysis. Its findings also provide compelling new evidence that strongly interconnected symptom networks confer an overall greater probability of treatment responsiveness in patients with psychosis, suggesting that antipsychotics achieve their effect by enhancing a number of central symptoms, which then facilitate reduction of other highly coupled symptoms in a network-like fashion.
Keywords: Schizophrenia, psychosis, antipsychotic, treatment resistance, network analysis, PANSS, Positive and Negative Syndrome Scale
Innov Clin Neurosci. 2017;14(11–12):59–65.
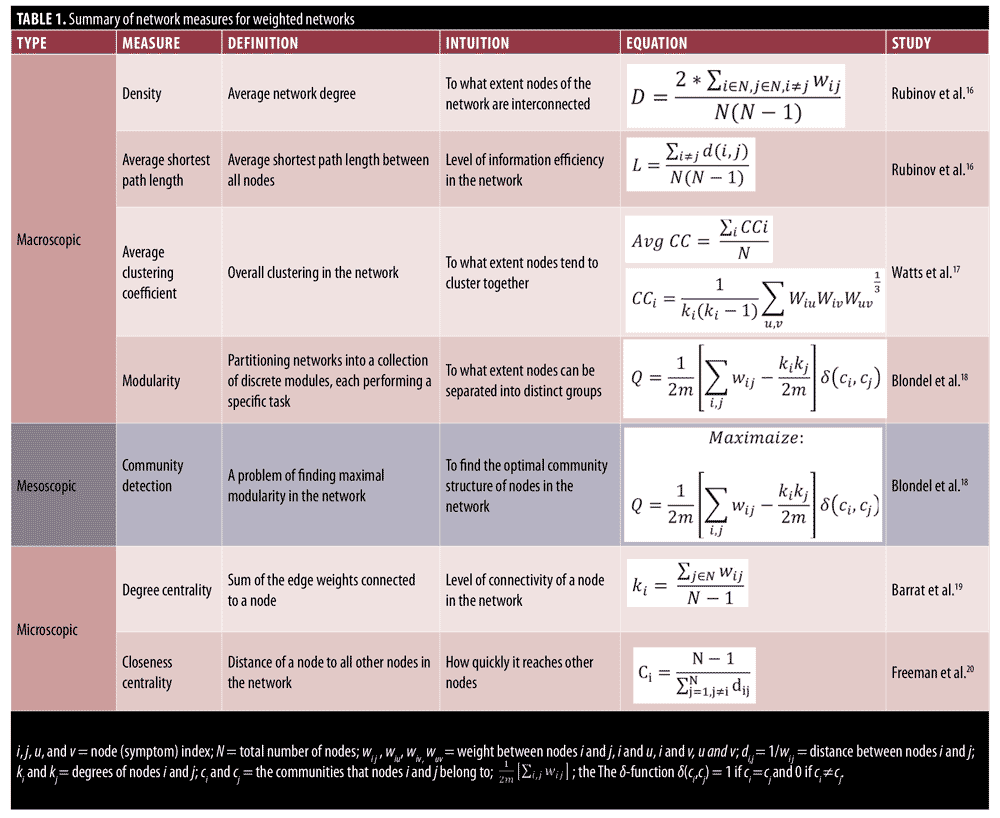
The Positive and Negative Syndrome Scale (PANSS) has become the gold-standard assessment for examining the efficacy of antipsychotic medications in the treatment of psychotic disorders.1 The PANSS has demonstrated sensitivity to change in many clinical trials to date.2–7 Studies using the PANSS have used traditional univariate statistical approaches to examine treatment effects, demonstrating that several first- and second-generation antipsychotics reduce mean PANSS domain scores relative to baseline and placebo.8,9 These studies support the utility of the PANSS as an outcome measure in clinical trials by focusing on the change in each individual symptom. However, less emphasis has been put on the collective behavior of symptoms (i.e., the impact of the symptoms on each other) and how changes in the interdependency patterns of symptoms could influence an individual’s psychopathology (e.g., their resistance or responsiveness to the treatment, vulnerability to develop a comorbid disorder). In this regard, network science has gained a lot of attention in studying psychiatric disorders by considering them as a network of interacting components (symptoms) represented by G=(V,E), where V is the set of symptoms connected to each other by the set of edges E that represent the relationship between these symptoms (usually the statistical dependency between the measured intensity of symptoms). Representing the psychiatric disorders as networks allows us to analyze different patterns of interaction between these symptoms using various network properties. Network properties can be categorized as macroscopic, mesoscopic, and microscopic based on the type of information they provide.15 Macroscopic properties, such as network density, characteristic path length, and average clustering coefficient, provide information about the overall connectedness of the network as a whole. Networks with a higher density, average clustering coefficient, and lower average shortest path length are tightly connected, which, regarding symptom networks, means that the symptoms are highly interdependent. The mesoscopic properties, on the other hand, characterize how different subsets of nodes in the network are connected with each other. The nodes that belong to one community tend to have a stronger connection with each other while having a weaker connection with the nodes in other communities. This notion of communities of symptoms is similar to symptom cluster analysis, in which a cluster of symptoms is identified using statistical analyses.28 However, symptom cluster analysis only focuses on the interdependency of symptoms within one cluster, whereas using mesoscopic measures, we can also analyze the interaction of cluster of symptoms with each other. Finally, the microscopic properties, such as degree centrality and closeness centrality, provide information about the role of each symptom and are useful for identifying the most influential symptoms in the symptoms interaction network. A summary of definitions and equations for all network measures is provided in Table 1.
One example of utilizing network analysis to examine psychiatric disorders is the study by Cramer et al,11 where the authors examined the vulnerability of patients to develop major depressive disorder (MDD) using symptom interaction networks, and suggested, based on their findings, that the individuals with more interconnected symptoms network are more vulnerable to developing MDD.11 Another example is the study by Borkulo et al12 in which they investigated the association between the symptom network structure of MDD patients with recovery from depression. According to their results, a more densely connected symptoms network is an indication of poor prognosis. Moreover, they identified fatigue/loss of energy, feeling guilty, and psychomotor retardation as important symptoms in the persistent MDD network, which could be potentially the target of clinical intervention.12 Finally, Beard et al13 also used network view to examine the relationship between anxiety and depression disorder. Their findings suggest that the strength of connection between depression disorder and anxiety disorders is higher than the strength of connection between depression-anxiety symptoms. Moreover, they identified the presence of a sad mood and worry as the most central symptoms in the network.13 According to these previous studies, antipsychotic treatments do not have a localized effect; rather, they achieve their goals via targeting a few central symptoms that have a spreading influence on a global symptom network.10–13 Although network-level changes in symptom dynamics have yet to be examined using the PANSS, the measure is ideally suited for this purpose given its wide range of item content and in-depth coverage of key symptoms domains (e.g., positive, negative, disorganized) relevant to psychotic disorders.
In the current study, we took a novel approach to examining the sensitivity of the PANSS to detecting treatment effects. Network analysis was used to examine antipsychotic treatment effects on publicly available archival PANSS data from the Clinical Antipsychotic Trials of Intervention Effectiveness (CATIE) study14 in treatment-responsive and treatment-resistant patients with psychotic disorders. Prior CATIE studies demonstrated the efficacy of second-generation antipsychotics for improving symptoms on the PANSS using traditional univariate statistical approaches. A network science approach has several distinct advantages over traditional approaches. First, it allows for the observation of whether treatment-responsive versus treatment-resistant patients differ in terms of how strongly interconnected their networks are at a macroscopic level. Since the macroscopic level characterizes the overall connectedness of the network, the more densely inter-connected networks confer greater overall risk for symptom exacerbation as, in such networks, most of the symptoms fall into a fewer number of clusters and the presence of some symptoms within each cluster increases the risk of occurrence for all other symptoms within that cluster. Alternatively, more inter-connected networks might be adaptive, facilitating rapid treatment response when medications effectively act on some symptoms, thereby improving the entire symptom presentation by spreading to the entire network. Second, network analysis allows for the determination of whether there are a few “clusters” of symptoms (i.e., communities with denser connections inside and fewer connections to the nodes outside the community) that are key players in treatment response, such that the treatment of a few key hub symptoms leads to improvement. Third, network analysis allows for the detection of symptom “centrality,” or identification of the symptom that is most core to a patient’s pathology (i.e., responsiveness or resistance to antipsychotics). The identification of the key symptom clusters or single central symptom might allow for the application of precision medicine designed to target the core features underlying an individual’s illness, rather than a broad approach that targets what is typically effective for a broad diagnostic category. Lastly, calculation of most of the network topological measures is straightforward, which, together with topographic maps (network representations), might enable clinical interpretation and a better understanding of the underlying psychopathology of individuals by clinicians.
Given the novelty of the analytic method, we took an exploratory approach to examining the network architecture of treatment-responsive and treatment-resistant patient groups in the CATIE trial. This included examining three aspects of network structure: macroscopic, mesoscopic, and microscopic properties. Macroscopic properties help us to understand the change of collective properties of the network connections as a whole after treatment. More specifically, it is more likely that an increase in density of the network connections after treatment is helpful for the improvement in overall prognosis of patients. Mesoscopic properties provide information about a subset of symptoms in the network (i.e., communities) where the reduction of the number of communities after treatment indicates the less segregated network and more integrated network. The microscopic properties (i.e., degree and closeness centralities) provide insights into the properties of individual symptoms in the network, which could help us identify individual symptoms that receive great impact from treatments (i.e., that experience a change in their centrality values) and could be able to spread the treatment effect via connections with other symptoms to the whole network. The Kolmogorov-Smirnov statistical test was used to examine whether there is a group difference (between treatment-resistant and treatment-responsive) of centrality measures before and after treatment. Identifying central symptoms and examining the change in the centrality patterns of symptoms after treatment could help us better understand the patient’s psychopathology representation, which in this case is resistance or responsiveness to the treatment.15
Methods
Participants. Data were drawn from the baseline and end of Phase I visits of the CATIE study.14 Details of the CATIE study and primary results have been published previously.5,21 The purpose of the CATIE study was to conduct a randomized clinical trial comparing the effectiveness of first- and second-generation antipsychotic medications in a large and representative sample of patients with psychotic disorders across a 57-site study. A double-blind design was used for Phase I of CATIE: 1,493 patients were randomized to receive one of five antipsychotics (olanzapine, perphenazine, quetiapine fumarate, risperidone, or ziprasidone hydrochloride) and were evaluated at baseline and again after 18 months or until treatment was discontinued. The sample evaluated for the current study included 1,049 patients who had complete Phase I data for all variables of interest. Of the 1,049 patients, 316 were deemed treatment-resistant and 733 were identified as treatment-responsive based on the efficacy failure outcome criteria of Phase I, which were defined as persisting severe symptoms despite adequate trials of the medications (inadequate therapeutic effect).21 Study inclusion/exclusion criteria have been published previously.21
Procedures. The current study was approved by local Institutional Review Boards at each of the 57 sites, and written informed consent was obtained from all participants. Competency to provide consent and decision-making was determined via the MacArthur Competence Assessment Tool for Clinical Research.22 A full list of measures used in the CATIE study has been published.21 The primary measure evaluated in the current study was the PANSS,1 which is a 30-item clinical rating scale that assesses the severity of positive, negative, and general psychiatric symptoms. In this study, the PANSS was administered by experienced, certified clinicians.29 CATIE PANSS raters were required to undergo a structured certification process that included initial training, initial certification, and then yearly recertification, in order to reduce drift and facilitate continued training. To pass the initial certification, each PANSS rater was required to code a series of recorded PANSS interviews and obtain an at least 0.70 Pearson correlation coefficient (PCC) when compared with the scores of expert raters. Certified raters were then required to maintain ongoing reliability via assessment every four months, during which time all raters were required to code a recorded PANSS interview and achieve a PCC of at least 0.70.29 Although initial raters did not always assess at all time-points due to staff turnover, all raters were held to this reliability standard.29 A full description of the rater certification and training process for the PANSS is available in Swartz et al.29
Network analysis. Network analysis was used to examine the structural/topological properties of the PANSS symptoms network at baseline and 18 months follow-up of Phase I and for treatment-resistant and -responsive patients. First, we constructed a symptom network for each patient group at the baseline and 18-month follow-up time-points by calculating the association between PANSS symptoms using the absolute value of the partial correlations among symptoms. Partial correlation estimates the level of association between two random variables while removing the effect of other variables. It was calculated based on the residual scores of the regression analysis as follows:
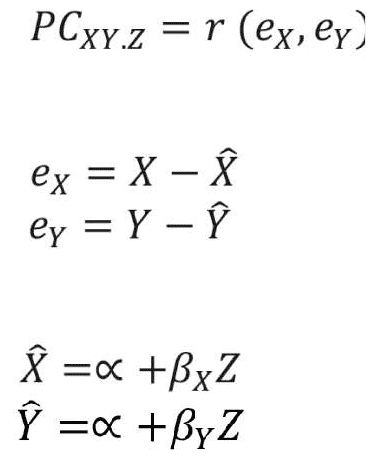
where X and Y represent variables (i.e. PANSS items), Z represents the set of controlling variables, e represents the residual scores obtained from the regression analysis, á and â represent the regression analysis parameters, r represents the correlation coefficient value, x-hat and y-hat are the predicted values of X and Y estimated using regression analysis, and PCXY.Z represents the partial correlation value between variables X and Y while controlling for the effect of the variables in Z.
After calculating the pairwise partial correlation between all symptoms, we obtained the connectivity matrix, which is a mathematical representation of a network, where rows i and columns j are the nodes of the network, and each cell wi j denotes the connectivity between nodes (i.e., PANSS items) i and j. Since our networks are weighted, each cell has a value between 0 and 1, representing the strength of connection between two nodes. Thus, the nodes of our network represent PANSS symptom items, and the edges represent the absolute value of the partial correlation between two symptoms. After constructing symptom networks using the absolute value of partial correlations, we calculated network properties to capture the interaction between different PANSS items in the treatment-responsive and treatment-resistant groups before and after treatment.
Network variables analyzed in this study included density, average shortest path length (characteristic path length), average clustering coefficient, modularity, closeness centrality, and degree centrality, which are defined as follows: Network density is defined as the sum of the link weights divided by the number of all possible links. The higher density of a network suggests that nodes of the network are tightly connected to each other. The network density is calculated as follows:16

where N represents the total number of nodes of the network, i and j represent nodes in the network, and wi j represents the weight of a link between i and j.
The average shortest path length is another useful network measure that aims at quantifying the efficiency of information transfer in networks. The average shortest path length is defined as the mean of shortest path lengths between all possible pairs of nodes in the network. A smaller average shortest path length indicates more efficient information transfer in the network. Average shortest path length is calculated as follows:16
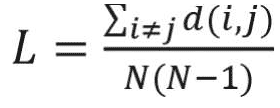
where di j is the shortest path from i to j, and N is the number of nodes in the network. In weighted networks, the distance between two nodes is defined as the inverse of corresponding link weight.16 Therefore, the shortest path of weighted networks is based on the inverse of link weights.
The clustering coefficient is a network measure to quantify the extent to which nodes tend to cluster together.15 In other words, the clustering coefficient shows how well the neighborhood of one particular node is connected. The clustering coefficient ranges from 0 for the nonconnected neighborhood to 1 for the fully connected neighborhood (also known as a clique). The clustering coefficient of a node in a weighted graph is calculated as follows:

where u, v,and i represent nodes in the network; ki represents weighted degree of node i; and W represents link weights in the network. The average clustering coefficient provides the overall clustering in the network, which is calculated as follows:17
where N is the number of nodes in the network; and CCi is the clustering coefficient of node i.
Many real-world networks tend to divide naturally into modules (also called clusters, communities, or groups). The strength of division of a network into modules is called modularity.5 Community detection is a problem of finding maximal modularity. Higher modularity of a network is an indication of dense connections within modules and sparse connections between nodes from different modules. Modularity for weighted networks is calculated as follows:18

where wi j is the link weight between nodes i and j; ki and kj are degrees of nodes i and j; ci and cj are the communities that nodes to which i and j belong; and m is equal to
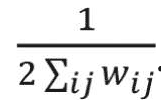
The delta function delta(ci,cj) equals to one if ci = cj and 0 if ci does not equal cj. Finding the communities in a network can be formulated as an optimization problem. In this study, we used a greedy optimization method known as the Louvain method to find the optimal community structures.18
The degree centrality of a node in the weighted undirected network is also called a “strength,” which simply is the sum of the edge weights connected to a specific node. This simple measure provides useful information for identification of important nodes in the network and provides first clues about the structure of the network. The nodes with high degrees of centrality are known as hubs and represent nodes that are connected to many other nodes in the networks.19 Degree centrality of a node for the weighted network is calculated as follows:
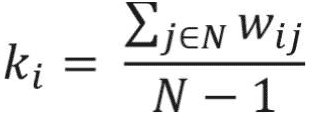
where N represents the set of nodes of the network and wi j represents link weight between node i and node j in the network.
The closeness centrality represents how much a particular node in the network is accessible to the other nodes in the network. Nodes with high degrees of closeness centrality can quickly access other nodes in the network. For example, in symptom interaction networks, any changes to the symptoms with high closeness centrality can quickly spread out to other reachable nodes in the network. Formally, the closeness centrality for weighted graphs is defined as:20
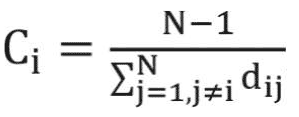
where N represents the number of nodes in the network and di j represents the weighted distance between nodes i and j.
We used a Kolmogorov-Smirnov test to examine whether the microscopic measures (closeness centrality and degree centrality) have a significant difference between treatment-resistant and treatment-responsive groups before and after treatment. In this study, macroscopic and mesoscopic variables cannot be analyzed for group differences because these variables provide a single value to describe the overall network structure/properties and therefore cannot be used to infer statistics for the group difference of treatment resistant and treatment responsive patients. Nevertheless, these variables are essential to understand the overall network structure/properties of the treatment resistant and responsive patients.
All analyses were conducted in Python programming language using the NetworkX package.23,24
Results
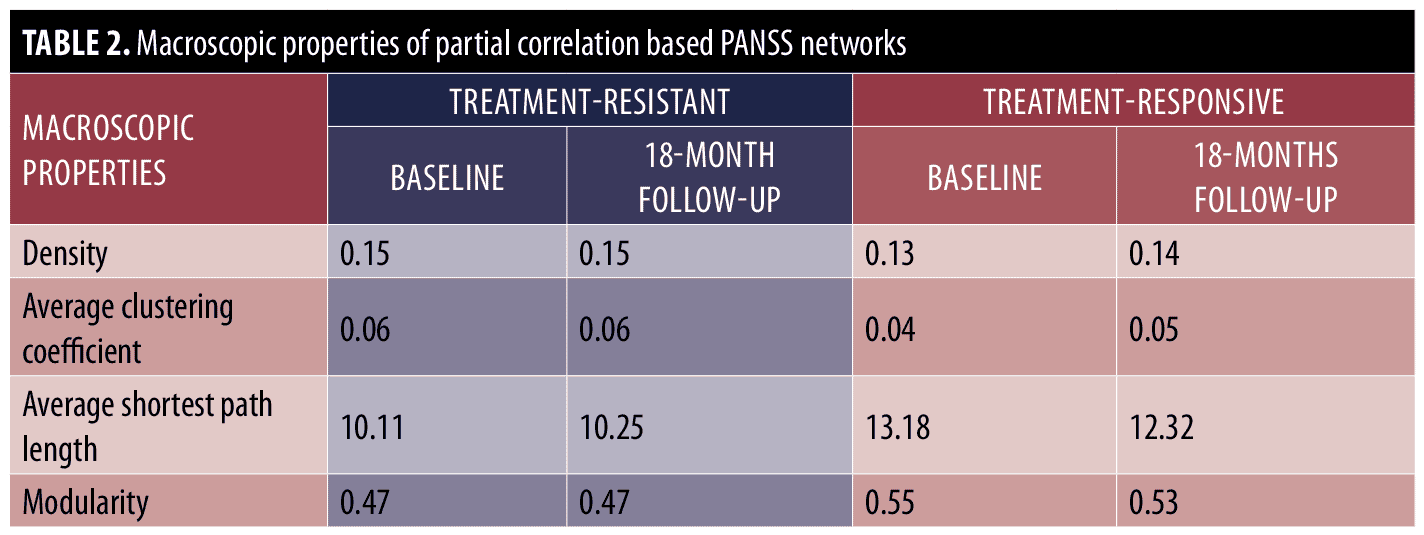
Macroscopic analysis. We first analyzed the partial correlation-based network of treatment-resistant and treatment-responsive patients at the macroscopic level before and after treatment. Table 2 shows the macroscopic properties of constructed networks. The results indicate that the networks of the treatment resistant group were denser (i.e., the treatment-resistant group networks displayed higher density and average clustering coefficients as well as lower average shortest path length and modularity) as compared with the treatment-responsive group before and after treatment. However, the within-group comparison of macroscopic properties indicates that density, average shortest path length, and average clustering coefficient of the symptom network were almost the same for the treatment-resistant group before and after treatment. On the other hand, in the treatment-responsive group, the density and average clustering coefficient were increased after treatment, while the average shortest path length and modularity were decreased. Thus, macroscopic level analyses suggest that the networks of treatment-responsive patients become more connected after antipsychotic treatment, whereas antipsychotics have no effect on global connectivity in treatment-resistant patients.
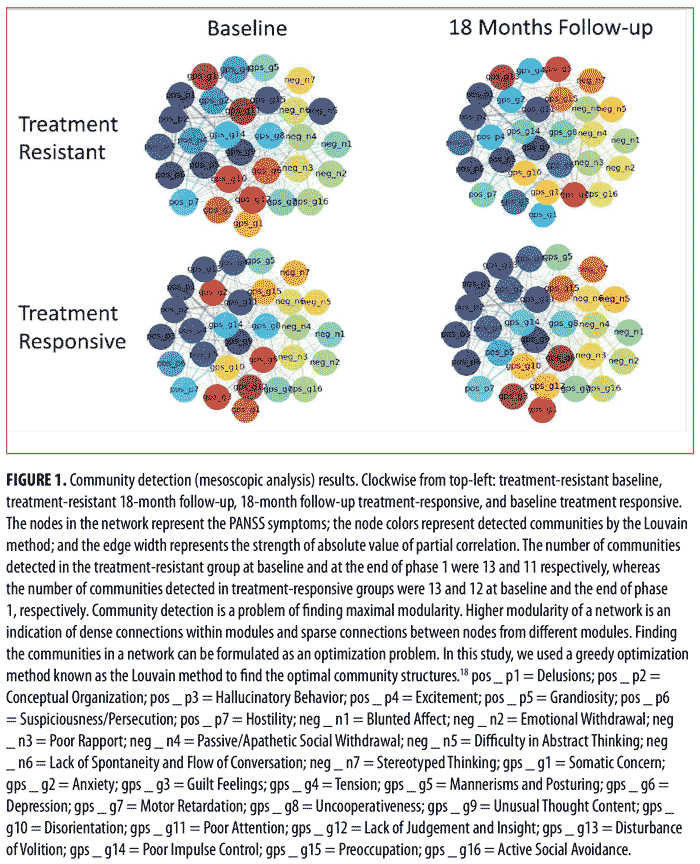
Mesoscopic analysis. We analyzed the symptom networks at the mesoscopic level using the Louvain method, which is a greedy optimization method (a step-by-step approach where, at each step, the optimum decision is made based on the information available at that step) to find the optimal community structure in the network (i.e., it examines clusters of highly interacting symptoms).18 As can be seen in Figure 1, the nodes (i.e., PANSS items) with the same color belong to one community and tend to have dense connections with each other and sparse connections with nodes of other colors (communities). Although the numbers of detected communities for the treatment-resistant and treatment-responsive groups were both 13 prior to treatment, the number of detected communities for the treatment-responsive group was lower than that for the treatment-resistant group after treatment (treatment resistant=11 and treatment responsive=12). Thus, mesoscopic level findings suggest that the symptom interaction network of the treatment-resistant group consists of less segregated communities after treatment as compared with that of the treatment-responsive group after treatment.
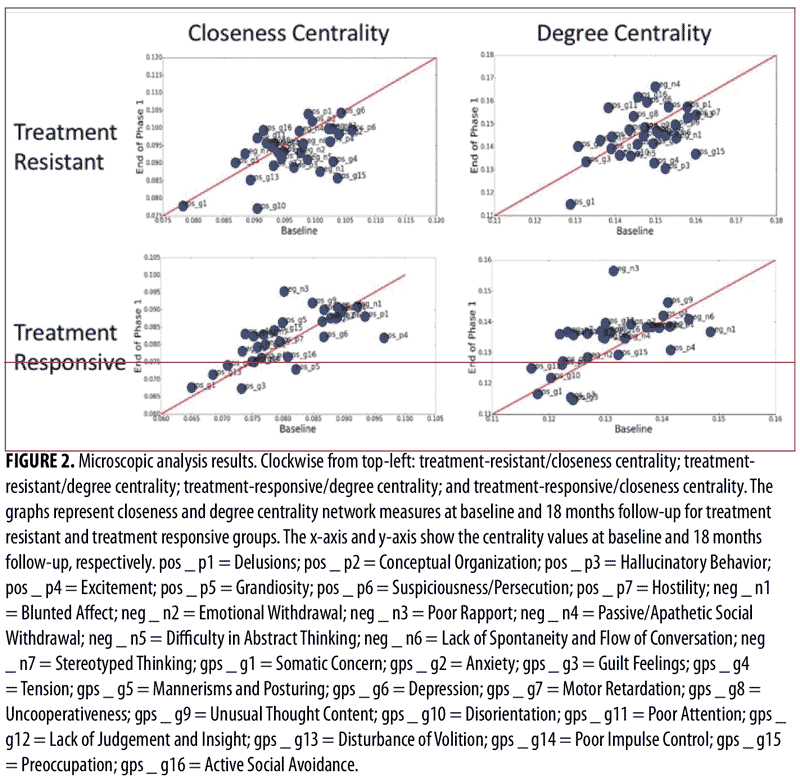
Microscopic analysis. We conducted a microscopic analysis of symptom networks to understand the behavior of single nodes (PANSS items) in the network. Figure 2 shows the closeness and degree centrality network measures at baseline and the end of phase 1 for the treatment-resistant and treatment-responsive groups. As can be seen in Figure 2, symptoms close to the red line did not change their centralities much between before and after the treatment; in order words, they were not remarkably affected by the treatment (i.e., the network shape was consistent before and after the treatment). On the other hand, there were certain symptoms that were farther from the red line (e.g., “Blunted Affect,” “Excitement,” and “Preoccupation”), which means that these were the symptoms that received a great impact by the treatment. Moreover, for the treatment-responsive patients, there was a general trend of symptoms going up in centralities (i.e., the symptoms were lining up slightly above the red line), which means that the network became more connected after treatment. This was not observed in the treatment-resistant patients; their symptoms behaved almost randomly before and after treatment.
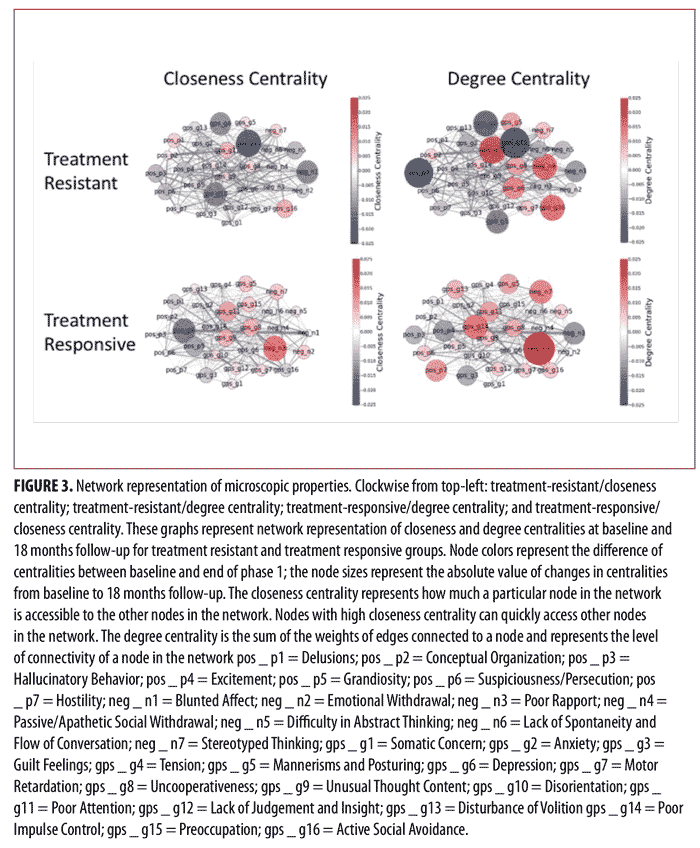
Similarly, Figure 3 shows the network representation of closeness and degree centralities at baseline and the end of Phase I for the treatment-resistant and treatment-responsive groups. The node colors represent the difference of centralities between baseline and the end of Phase I. The negative values for node color reflect the decrease of centralities from baseline to the end of Phase I, while the positive values represent the increase of centralities from baseline to the end of Phase I. Moreover, the node size represents the absolute value of changes in centralities before and after treatment (baseline to the end of Phase I). As can be seen in Figure 3, the centrality values for certain symptoms markedly changed after treatment. More specifically, in the treatment-resistant group, “Preoccupation” and “Hallucinatory Behavior” demonstrated the most noticeable change in centrality values after treatment, while, in treatment-responsive patients, “Poor Rapport” had the most noticeable change in centrality values after treatment.
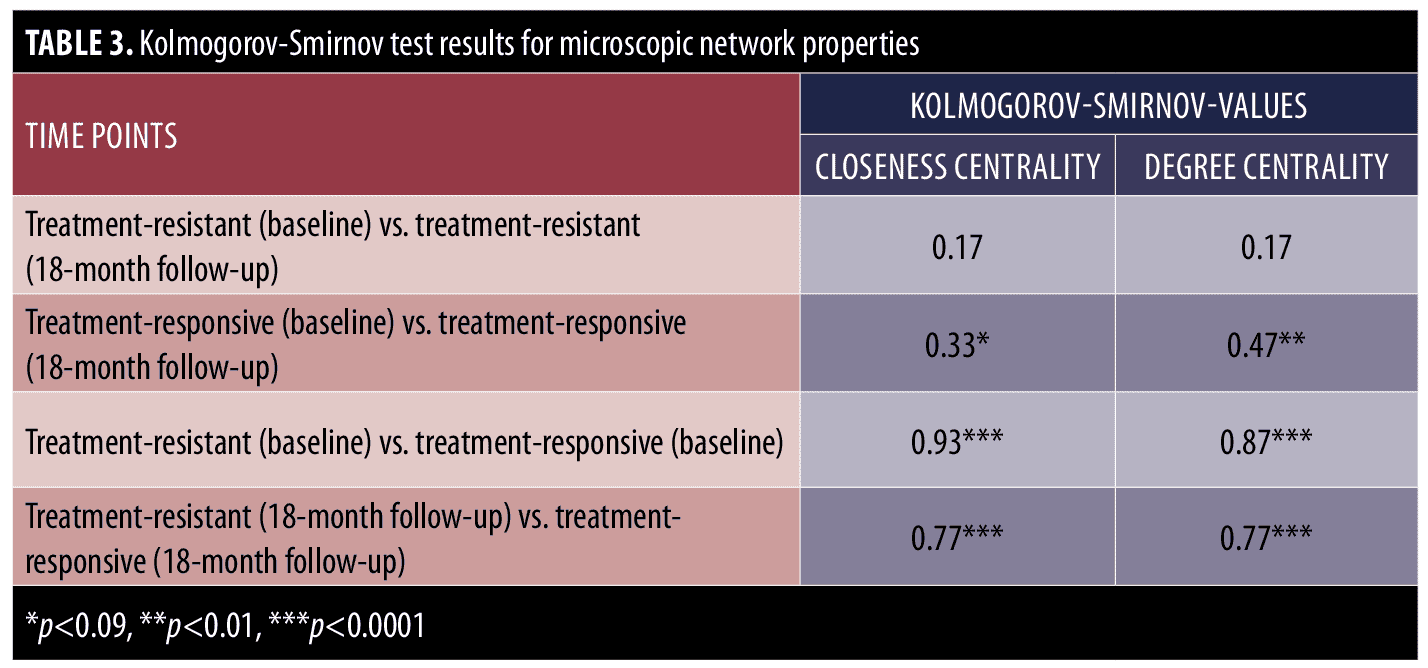
The Kolmogorov-Smirnov test was used to examine the group differences of treatment-resistant and treatment-responsive groups in microscopic network properties. As can be seen in Table 3, there were no significant differences in the closeness and degree centrality of symptoms in the treatment-resistant group at baseline and at the end of Phase 1 visits; however, there were differences in the closeness centrality (p<0.09) and degree centrality (p<0.01) of symptoms in the treatment-responsive group at the baseline and end of Phase I visits. In other words, in contrast with the treatment-responsive group, the microscopic network properties of the treatment-resistant group did not change significantly from baseline to the end of phase I. Moreover, the between-group comparisons indicate that there were significant differences in closeness and degree centrality values of the treatment-resistant and treatment-responsive groups before and after treatment (Table 3).
Discussion
The network view considers psychiatric disorders as complex systems consisting of many interacting components (symptoms) with some emergent behavior (i.e., resistance/responsiveness to the treatment). Hence, within this perspective, the psychiatric disorders are more than just the sum of the symptom intensities. For example, even though there might not be a mean change on a certain symptom (i.e., PANSS item) as a result of treatment, this symptom could still play a critical role in the overall responsiveness of the patient to treatments because of its interdependency with other important symptoms. In this regard, conventional univariate statistical analysis cannot fully explain the treatment responsiveness of patients to antipsychotic medications. Hence, we used analytical tools of network science to explore the sensitivity of the PANSS in detecting treatment effects. Specifically, we examined changes in symptom networks following antipsychotic administration in treatment-resistant and -responsive patients with psychosis who participated in the CATIE trial.
Overall, our results suggest that the PANSS is highly sensitive in detecting treatment effects from a network perspective. Given the rapid advances in applying network analysis to examine psychopathology and treatment effects,10,11 these findings are of considerable importance. The PANSS might be ideal not only for detecting whether an antipsychotic treatment is effective (i.e., via considering mean changes in symptom levels relative to baseline and placebo using traditional univariate statistics) but also for determining why it is effective from a network perspective (i.e., by determining whether a treatment increases or decreases global connectivity within an individual’s symptom network and identifying which symptoms are most central to treatment response).
There were also important implications for understanding how patients become treatment-resistant versus -responsive from a network perspective. Results of the macroscopic, mesoscopic, and microscopic level analyses revealed a consistent pattern of findings. Treatment-resistant patients demonstrated randomly fluctuating associations among symptoms regardless of whether they were receiving antipsychotic treatment. In contrast, treatment-responsive patients displayed an increase in network connectivity following treatment, such that improvement of certain key symptoms or clusters of symptoms (communities) precipitated improvements in global symptom presentation. Interestingly, the most central symptoms following antipsychotic administration in treatment-responsive patients were Blunted Affect, Excitement, and Poor Rapport. This finding suggests that when antipsychotics do have beneficial effects on these specific symptoms, this leads to a spreading effect and improvement in positive (i.e., hallucinations and delusions) and other symptoms as well (e.g., disorganization). In a sense, the positive symptoms that typically bring patients in for treatment might be secondary features in terms of treatment response to these other symptoms, which, when improved, spur improvements in positive symptoms. Why these particular symptoms would be so central is unclear, and future studies are needed to replicate and extend these findings by detecting pathophysiological mechanisms that allow for improvements in these symptoms to precipitate changes in the entire symptom network. Knowing that these symptoms are central suggests that adjunctive treatment with other types of medication (e.g., mood stabilizers, antidepressants, anxiolytics) might be an appropriate approach to facilitating rapid response in patients who will respond to antipsychotics. In contrast, treatment-resistant patients had a different pattern of symptom centrality, with Suspiciousness/Persecution, Hostility, Depression, and Passive/Apathetic Social Withdrawal being the most central ones. These are more classic symptoms, suggesting that these features were core to the treatment-resistant patients’ pathology and unchanged by antipsychotic treatment. Their dense connections with other symptoms might explain why they are so resistant to treatment. Essentially, these patients might require more momentum to experience global symptom improvement, since all other symptoms hinge on the improvement of these positive symptoms.
These findings extend prior work on antipsychotic treatment resistance in several ways. Prior studies indicate that factors such as obstetric complications, age of onset of psychosis, age of first antipsychotic treatment, premorbid functioning, substance abuse history, male sex, family history of schizophrenia, and number of hospitalizations predict treatment resistance.25,26 The current findings provided novel evidence that treatment response might best be considered from a network perspective, rather than conceptualizing individual symptoms or symptom domains (e.g., positive, negative, disorganized) as mutually exclusive entities. Antipsychotic treatment response appears to be the result of interactions among a range of interacting symptoms that traverse traditional symptom dimensions. Moreover, consistent with prior studies of treatment-resistant schizophrenia, our microscopic analysis suggests that negative and general psychotic symptoms (e.g., excitement, hostility, depression) could be as important as positive symptoms (traditionally known as predictors of treatment-resistant schizophrenia) in better understanding the psychopathology of treatment-resistant schizophrenia patients.26,27
Certain limitations should be considered. First, we wanted our findings to be broadly applicable to the use of antipsychotics. We did not evaluate network dynamics resulting from individual antipsychotics in the CATIE study; however, this could be an important future direction because the antipsychotics examined in the trial do have some differences in the pathophysiological mechanisms they target. Second, the macroscopic and mesoscopic analyses do not allow for a statistical comparison of differences among treatment-responsive and -resistant groups. In this study, this is due to the nature of data where one single value is obtained for the whole network from macroscopic and microscopic analysis. Nonetheless, the information obtained from these analyses is essential to gain insight into the network structure of psychotic disorders and subsequently develop appropriate fine-grained analysis. Finally, our results are specific to the phase of illness studied in CATIE. Future studies should take a network science approach to exploring treatment response in the first episode and in prodromal participants as well. The current findings suggest that the PANSS might be an optimal measure for detecting treatment effects from a network perspective.
References
- Kay SR, Fiszbein A, Opler LA. The Positive and Negative Syndrome Scale (PANSS) for schizophrenia. Schizophr Bull. 1987;13(2):2: 261–276.
- Furukawa TA, Levine SZ, Tanaka S, et al. Initial severity of schizophrenia and efficacy of antipsychotics: participant-level meta-analysis of 6 placebo-controlled studies. JAMA Psychiatry. 2015;72(1):14–21.
- Johnsen E, Kroken RA, Wentzel-Larsen T, et al. Effectiveness of second-generation antipsychotics: a naturalistic, randomized comparison of olanzapine, quetiapine, risperidone, and ziprasidone. BMC Psychiatry. 2010;10:10–26.
- Leucht S, Arbter D, Engel R, et al. How effective are second-generation antipsychotic drugs? a meta-analysis of placebo-controlled trials. Molecular psychiatry. 2009;14(4):429–447.
- Lieberman JA, Stroup TS, McEvoy JP, et al. Effectiveness of antipsychotic drugs in patients with chronic schizophrenia. N Engl J Med. 2005;353(12):1209–1223.
- McEvoy JP, Lieberman JA, Stroup TS, et al. Effectiveness of clozapine versus olanzapine, quetiapine, and risperidone in patients with chronic schizophrenia who did not respond to prior atypical antipsychotic treatment. Am J Psychiatry. 2006;163(4):600–610.
- Stroup TS, Lieberman JA, McEvoy JP, et al. Effectiveness of olanzapine, quetiapine, and risperidone in patients with chronic schizophrenia after discontinuing perphenazine: a CATIE study. Am J Psychiatry. 2007;164(3):415–427.
- Zacher JL, Holmes JC. Second-generation antipsychotics: A review of recently-approved agents and drugs in the pipeline. 2012;47:106–121.
- Citrome L. A review of aripiprazole in the treatment of patients with schizophrenia or bipolar I disorder. Neuropsychiatr Dis Treat. 2006;2(4):427–443.
- Frewen PA, Schmittmann VD, Bringmann LF, et al. Perceived causal relations between anxiety, posttraumatic stress and depression: extension to moderation, mediation, and network analysis. Eur J Psychotraumatol. 2013;4(1):20656–20670.
- Cramer AO, van Borkulo CD, Giltay EJ, et al. Major depression as a complex dynamic system. PloS One. 2016;11(12):e0167490.
- van Borkulo C, Boschloo L, Borsboom D, et al. Association of symptom network structure with the course of depression. JAMA Psychiatry. 2015;72(12):1219–1226.
- Beard C, Millner A, Forgeard M, et al. Network analysis of depression and anxiety symptom relationships in a psychiatric sample. Psychol Med. 2016;46(16):3359–3369.
- Manschreck TC, Boshes RA. The CATIE schizophrenia trial: results, impact, controversy. Harv Rev Psychiatry. 2007;15(5):245–258.
- Sayama H. Introduction to the Modeling and Analysis of Complex Systems. Geneseo, NY: Open SUNY Textbooks; 2015.
- Rubinov M, Sporns O. Complex network measures of brain connectivity: uses and interpretations. 2010;52(3):1059–1069.
- Watts DJ, Strogatz SH. Collective dynamics of’small-world’networks. 1998;393(6684):440–442.
- Blondel VD, Guillaume JL, Lambiotte R, et al. Fast unfolding of communities in large networks. J Stat Mech Theor Exp. 2008;10:P10008.
- Barrat A, Barthelemy M, Pastor-Satorras R, et al. The architecture of complex weighted networks. Proc Natl Acad Sci USA. 2004;101(11):3747–3752.
- Freeman LC. Centrality in social networks conceptual clarification. Soc Networks. 1978;1(3): 215–239.
- Stroup TS, McEvoy JP, Swartz MS, et al. The National Institute of Mental Health Clinical Antipsychotic Trials of Intervention Effectiveness (CATIE) project: schizophrenia trial design and protocol development. Schizophr Bull. 2003;29(1):15–31.
- Appelbaum PS, Grisso T. MacArthur competence assessment tool for clinical research (MacCAT-CR), Sarasota, FL: Professional Resource Press/Professional Resource Exchange; 2001.
- Software for Complex Networks website. Available at: https://networkx.github.io/. Accessed August 9, 2017.
- Foundation PS. Python website. Available at: https://www.python.org/. Accessed August 9, 2017.
- Elkis H, Buckley PF. Treatment-resistant schizophrenia. Psychiatr Clin North Am. 2007;30(3):511–533.
- Lindenmayer JP. Treatment refractory schizophrenia. Psychiatr Q. 2000;71(4):373–384.
- Jones S, Castle D. Management of treatment resistant schizophrenia. Afr J Psychiatry. 2006; 9(1):17–23.
- Skerman HM, Yates PM, Battistutta D. Multivariate methods to identify cancer-related symptom clusters. Res Nurs Health.2009;32(3):345–360.
- Swartz, MS, Perkins, DO, Stroup, TS, et al. Assessing clinical and functional outcomes in the Clinical Antipsychotic Trials of Intervention Effectiveness (CATIE) schizophrenia trial. Schizophr Bull. 2003;29(1):33–43.


