
by Harald Murck, MD, PhD; Thomas Laughren, MD; Femke Lamers, PhD; Rosalind Picard, ScD; Sebastian Walther, MD; Donald Goff, MD; and Stephen Sainati, MD, PhD
Dr. Murck is with Acorda Therapeutics in Ardsley, New York, and Phillips-University Marburg, Marburg, Germany (Dr. Murck was with Covance Inc., Princeton, New Jersey, during the preparation of this manuscript); Dr. Laughren is with Laughren Consulting, Rockville, Maryland, USA; Dr. Lamers is with the Department of Psychiatry, VU University Medical Center / GGZ inGeest, Amsterdam, The Netherlands; Dr. Picard is with MIT Media Laboratory and Empatica, Inc., Boston, Massachusetts, USA; Dr. Walther is with University Hospital of Psychiatry, Bern, Switzerland; Dr. Goff is with the Department of Psychiatry, NYU Langone Medical Center, New York, New York, USA; Dr. Sainati is with FORUM Pharmaceuticals, Boston, Massachusetts, USA.
Innov Clin Neurosci 2015;12(3–4 Suppl A):26S–40S.
Funding: No funding was provided for this article.
Financial disclosures: Dr. Murck has no conflicts of interest relevant to the content of this article. Dr. Laughren is a part-time employee of the MGH CTNI and consults or has consulted for AbbVie, Acadia, Alcobra, AstraZeneca, Axsome, Camurus, Cerecor, Corcept, Curemark, Dart NeuroScience, Delpor, Durect, Edgemont, EnVivo, ERT, Fabre Kramer, Gedeon Richter, Janssen, JDS Therapeutics, King & Spalding, Lilly, MAPS, MedAvante, Medgenics, Naurex, Neurenl, Neurocrine Biosciences, NIMH, Noven, Omeros, Pfizer, Quinn Emanuel, Retrophin, Reviva, Roche, Salamandra, Shire, Spinifex, Sunovion, Taisho, Targacept, Teva, Theravance, Tonix, Transition Therapeutics, Ulmer & Berne, and Zogenix. Dr. Lamers is supported by a FP7-Marie Curie CIG (334065). Dr. Picard is Chairman of the Board, Chief Scientist, and shareholder with Empatica, Inc., a small company that makes a sensor that can provide the data described in part of this research (this article does not promote any Empatica products). Dr. Walther has no conflicts of interest relevant to the content of this article. Dr. Goff has no conflicts of interest relevant to the content of this article. Dr. Sainati is a full-time employee of FORUM Pharmaceuticals, Inc.
Key words: Wearable devices, biomarker, predictive marker, surrogate marker, treatment outcome
Abstract: The success rate in the development of psychopharmacological compounds is insufficient. Two main reasons for failure have been frequently identified: 1) treating the wrong patients and 2) using the wrong dose. This is potentially based on the known heterogeneity among patients, both on a syndromal and a biological level. A focus on personalized medicine through better characterization with biomarkers has been successful in other therapeutic areas. Nevertheless, obstacles toward this goal that exist are 1) the perception of a lack of validation, 2) the perception of an expensive and complicated enterprise, and 3) the perception of regulatory hurdles. The authors tackle these concerns and focus on the utilization of biomarkers as predictive markers for treatment outcome. The authors primarily cover examples from the areas of major depression and schizophrenia. Methodologies covered include salivary and plasma collection of neuroendocrine, metabolic, and inflammatory markers, which identified subgroups of patients in the Netherlands Study of Depression and Anxiety. A battery of vegetative markers, including sleep-electroencephalography parameters, heart rate variability, and bedside functional tests, can be utilized to characterize the activity of a functional system that is related to treatment refractoriness in depression (e.g., the renin-angiotensin-aldosterone system). Actigraphy and skin conductance can be utilized to classify patients with schizophrenia and provide objective readouts for vegetative activation as a functional marker of target engagement. Genetic markers, related to folate metabolism, or folate itself, has prognostic value for the treatment response in patients with schizophrenia. Already, several biomarkers are routinely collected in standard clinical trials (e.g., blood pressure and plasma electrolytes), and appear to be differentiating factors for treatment outcome. Given the availability of a wide variety of markers, the further development and integration of such markers into clinical research is both required and feasible in order to meet the benefit of personalized medicine. This article is based on proceedings from the “Taking Personalized Medicine Seriously—Biomarker Approaches in Phase IIb/III Studies in Major Depression and Schizophrenia” session, which was held during the 10th Annual Scientific Meeting of the International Society for Clinical Trials Meeting (ISCTM) in Washington, DC, February 18 to 20, 2014.
Introduction
In 2005, it was well recognized that drug candidates fail in development for one of four major reasons: 1) the compound is given to the wrong subjects; 2) the compound is given at the wrong dose or schedule; 3) the favorable effects of the compound are not detected; or 4) the compound has a significant effect in animal models in laboratory species, but not in humans.[1]
Almost a decade later, the same issues of patient selection and target engagement were dominant themes in a review of the failures in drug development at Astra Zeneca between 2005 and 2010.[2] One area, which received considerable interest in the meantime for the solution of these problems, is the exploration of individualized medicine by utilizing biomarkers.
There is, however, the perception that there are principal obstacles to the development and use of biomarkers. The lack of a generally accepted biological theory of psychiatric diseases (i.e., a clear understanding of the connection between biological changes and disturbed behavior and perception) is a fundamental problem. There is the notion of a principal gap between biological and psychological phenomena. A recent survey in practicing psychiatrists in the United States[3] found a clear indication for the persistence of brain-mind dualism in psychiatric reasoning. Biomarker assessments may help to bridge this gap. More practical concerns come from the notion that biomarkers are in principal difficult to assess and expensive. Furthermore, there is a lack of clarity about regulatory implications of the use of biomarkers. We will see that these concerns may arise from a lack of clarity about different types of biomarkers and their differing practical value, in particular predictive biomarker versus surrogate marker (Table 1).[5–8]
Here, the development of technologies and methodologies in personalized medicine (biomarkers) focusing on improving patient selection and detecting target engagement to enhance the success rate of later stage clinical trials and to deliver significantly improved clinical outcomes from new medications are considered.
This article is based on proceedings from the “Taking Personalized Medicine Seriously—Biomarker Approaches in Phase IIb/III Studies in Major Depression and Schizophrenia” session, which was held during the 10th Annual Scientific Meeting of the International Society for Clinical Trials Meeting (ISCTM) in Washington, DC, February 18 to 20, 2014.
REGULATORY ISSUES: THE USE OF BIOMARKERS IN PHASE IIB/III STUDIES IN DEPRESSION AND SCHIZOPHRENIA (T. Laughren)
The fundamental problem facing psychiatric drug development is that the clinical targets are imprecise. There remains a profound lack of understanding of the underlying neurobiology of psychiatric disorders. This is hardly surprising given the complexity of the human brain, and the fact that we understand little about its normal functions, let alone malfunctions. The long-awaited Diagnostic and Statistical Manual of Mental Disorders, Fifth Edition (DSM 5) was released in May of 2013 with considerable controversy. For all the fanfare and anticipation, DSM 5 serves no better than the previous editions to define psychiatric pathophysiology in a manner that can inform development of treatment interventions. It could be said that, ironically, even though many clinicians and investigators may not find the DSM 5 optimal, the entire field remains heavily reliant on it. Currently the major challenge facing the field is finding better, more biologically based approaches to carving up the psychiatric illness space (i.e., moving beyond DSM). This will require quantum leaps in our fundamental understanding of human brain neurophysiology and pathophysiology: a true challenge for 21st century neuroscientists.[9]
Beyond DSM for psychiatric drug development, there has been increasing interest in targeting phenomenological domains, albeit without neurobiological understanding, within accepted DSM diagnostic entities (e.g., cognitive impairment associated with schizophrenia [CIAS]) as well as across DSM diagnostic entities (e.g., agitation, impulsivity, specific cognitive deficits). There has also been interest in biological subgroups, defined by various biomarkers, even without clinical understanding of what these classifications might represent. These types of biological subgroups could be based on any of the many different types of biomarkers that have been proposed to date. As with phenomenological domains, these could be applied within or across DSM diagnostic entities. One might consider the research domain criteria (RDoC) as way of combining biology and phenomenology, but it remains to be seen whether or not these will serve as useful targets for drug development.
Definition of biomarkers. The United States Food and Drug Administration (FDA) defines biomarkers as measureable characteristics that reflect physiological, pharmacological, or disease processes in animals or humans. As such, biomarkers have many applications in drug development. The focus of the current discussion is primarily on finding biomarkers that can predict efficacy or risk associated with drug treatment (i.e., an approach to subgrouping the larger population into responsive vs. nonresponsive or at risk vs. not at risk). Examples include imaging measures, serum assays, genetic assays, physiological measures, histopathologic findings, psychological tests, and demographic variables (e.g., age, gender, race) (Figure 1).
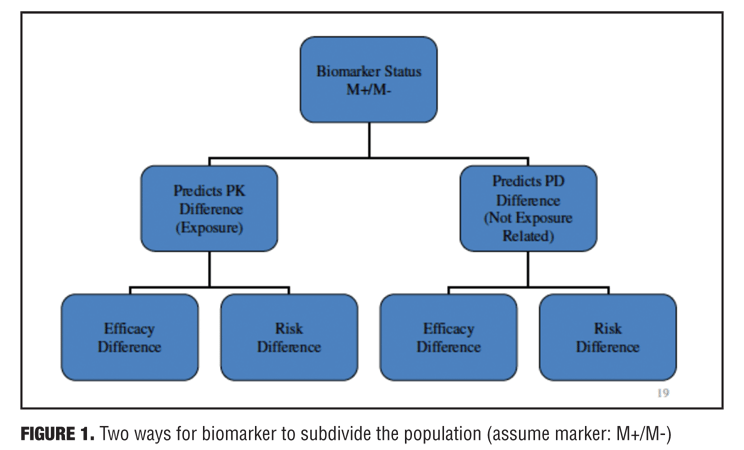
Among the different roles served by biomarkers are included predictive, prognostic and surrogate properties. Predictive biomarkers are useful for identifying patient subgroups that respond differentially, either for benefit or for risk. Prognostic biomarkers are useful in predicting outcome for subgroups, independent of disease or treatment (e.g., cardiovascular risk profile). Surrogate biomarkers (endpoints) can potentially serve as substitutes for clinical endpoints (e.g., blood pressure or cholesterol).
Genomic biomarkers have long been known as predictors of pharmacokinetic differences among individuals that lead to differences in plasma drug exposure. Genetically polymorphic cytochrome P450 (CYP) enzymes are associated with differences in plasma levels, resulting in differences in efficacy and safety. Several such biomarkers are reflected in labeling for certain compounds, including some psychiatric drugs (e.g., CYP2B6, CYP2C9, CYP2C19 and CYP2D6). Other biomarkers serve as predictors of pharmacodynamic response. One example on the efficacy side is the nonpsychiatric biologic Herceptin (trastuzumab). The Her-2 gene expresses a cell surface receptor needed for cell growth. In about 30 percent of breast cancers, the Her-2 gene is over-expressed. Trastuzumab is an antibody that blocks this cell surface receptor. There is a kit available for identifying this subgroup of breast cancer patients. During the development of trastuzumab, the clinical trials included mostly over-expressing patients. This led to a labeled indication only for over-expressing patients. A well-known example from the central nervous system (CNS) pharmacopoeia involves the prediction of a serious safety outcome for the drug carbamazepine—Stevens-Johnson Syndrome (SJS), a serious skin reaction.
Example for the utilization of biomarkers in early clinical development. Biomarkers may also be useful for increasing the efficiency in earlier phases of drug development. One approach comes from the National Institute of Mental Health (NIMH) programs Fast-Fail [FAST] and RDoC [http://www.nimh.nih.gov/research-priorities/research-initiatives/fast-fast-fail-trials.shtml]. This is a study being conducted in the FAST-Mood and Anxiety Spectrum Disorders (MAS) program, with Andrew Krystal at Duke University Medical Center as lead investigator. This represents a fundamental change in the proof of concept (POC) paradigm and a move away from DSM toward RDoC constructs. The focus is on demonstrating target engagement as the primary goal of this POC. The aim is not only to quickly identify compounds that merit more extensive testing, but also to identify targets in the brain for the development of additional candidate compounds. FAST will aim at answering the following questions:
• Does the compound engage a target in the brain, for example, does it interact with a specific receptor in brain cells or alter signaling in the brain by a specific neurotransmitter?
• Does it measurably alter a feature of brain function (e.g., change the results of a test of memory, cognition, or attention)?
Unlike standard clinical drug-testing trials, clinical trials in FAST are small (about 10–30 subjects), and will be in human patients. Years of experience in drug testing suggests that positive results in animals do not necessarily translate to humans. With this type of testing, compounds that are found to engage a target in the brain, and alter an indicator (or biomarker) of brain function can quickly go forward to further testing. Negative results will avoid costly and time-consuming testing, and also provide information that will be helpful in designing future trials. The identification of new targets in the brain identified through this approach will broaden the avenues available for development and screening of new candidate compounds.
The following summarizes the general approach for planning such a study. First, identify a compound of interest. Then identify a brain target (circuit) thought to be engaged by that compound (target engagement [TE]). Subsequently, identify a biomarker that signals TE. And finally, identify a behavioral construct (preferably RDoC) thought to be represented by the brain target. This approach has now been applied in a program targeting the RDoC construct anhedonia. A compound has been identified. The ventral striatum (VS) has been determined to be the circuit of interest (in particular, activation by a monetary incentive delay task in VS). Functional magnetic resonance imaging (fMRI) has been selected as a biomarker for VS activation. As noted, anhedonia is the RDoC construct that has been targeted. The Snaith-Hamilton Pleasure Scale (SHAPS) is being used as a specific behavioral measure for anhedonia. Patients are selected based on their threshold SHAPS scores. Patients could present with either major depressive disorder (MDD) or general anxiety disorder (GAD) (i.e., this program cuts across DSM categories). The Hamilton Rating Scale for Depression (HAM-D) and Hamilton Rating Scale for Anxiety (HAM-A) are also measured, but fMRI is the primary outcome.
Regulatory challenges: pseudospecificity. There are fundamental regulatory challenges to endorsing an alternative to the DSM classification of psychiatric illness. It is necessary to provide a rationale for an alternative approach. This is true whether dealing with a phenomenological domain, a biomarker-defined subgroup or an RDoC construct. The key regulatory issue is pseudospecificity. For a regulatory agency, in particular FDA, a claim is considered pseudospecific if it is viewed as artificially narrow. One example might be a demographic subgroup (e.g., depression in women or in the elderly). Another example might be a symptom, or symptom cluster, that is part of a defined DSM syndrome (e.g., hallucinations in schizophrenia). Attempting to target a claim for a DSM syndrome in the context of some comorbid condition (e.g., depression with cardiovascular disease, post-stroke patients, or in Parkinson’s disease) might also be considered pseudospecific. Similarly, targeting a subgroup of some recognized DSM entity that is arbitrarily defined by some biomarker would also likely be considered pseudospecific.
In the absence of strong argument and evidence to the contrary, regulators will likely default to the position that the requested claim is pseudospecific. However an agency’s initial rejection of claim as pseudospecific might well represent a “straw man” position. In other words, the objection may be overcome with arguments and data to show validity and value of targeting a particular domain or biomarker-defined subgroup. For a claim targeting a particular domain, an approach to overcoming regulatory concern of pseudospecificity is to produce evidence that available drug treatments in the class do not address the domain in question. For some conditions, this might be accomplished by demonstrating that there is a residual phase of illness with persistence of symptoms in this domain, or perhaps evidence for a subtype of the disorder, with prominence of symptoms in this domain, and that is not responsive to available treatments.
One noteworthy example of successful establishment of a domain within the schizophrenic syndrome is CIAS. This is a well-established aspect of schizophrenia that is not well addressed by available treatments. CIAS has a different time course than positive symptoms of schizophrenia, often being present even before the onset of psychosis and persisting into the “residual” phase of the illness. Both the FDA and the European Medicines Agency (EMA) have endorsed CIAS as a legitimate target for drug development. Other domains within DSM-defined syndromes that FDA has accepted as legitimate targets for drug development include negative symptoms of schizophrenia, suicidal ideation and behavior in schizophrenia, agitation in schizophrenia and bipolar disorder, irritability of autism, impulsive aggression in attention deficit hyperactivity disorder (ADHD), and agitation/aggression in dementia.
Another pathway for overcoming a regulatory concern for pseudospecificity that should work for either a domain or a biomarker-defined subgroup would be to show drug response specificity for that domain or subgroup. One way to accomplish this would be to show that the drug works only for that domain or only for the biomarker-defined subgroup. Alternatively, a company might try to show that its drug is superior to another drug in the class on this domain or in this biomarker-defined subgroup.
The question of validation (or qualification) of biomarkers often comes up in the context of these discussions, and there is much confusion about what this means. It is useful to distinguish between analytical validation of a biomarker and clinical validation. Analytical validation concerns the performance of the biomarker assay in accurately identifying patients who are marker positive (M+) and marker negative (M-). So this involves determining sensitivity, specificity, positive predictive value (PPV), and negative predictive value (NPV) for the assay with regard only to marker status. Clinical validation (also known as qualification) has a broader meaning with regard to what clinical outcomes the marker can predict. How this is accomplished depends on the particular use of the marker in question. This discussion is focused mostly on predictive biomarkers, and for this purpose, a clinical trial is the mechanism for demonstrating whether or not a particular biomarker has clinical predictive value. It is important to note that, for this limited purpose, a biomarker only needs to be validated for a particular drug of interest. Importantly, a marker that was identified in exploratory datasets needs to be confirmed in a pre-specified way in confirmatory studies. For prognostic and surrogate markers, the process of validation is broader and not specific to any particular drug.
Ultimately, companies are interested in understanding what is needed to get a biomarker into the labeling for a particular drug product. The way to accomplish this is to design a coherent hypothesis testing strategy. Assuming the focus is on an accepted DSM diagnostic category, e.g., schizophrenia, the ideal approach from regulatory perspective would be as follows. A valid and reliable biomarker assay would have been developed before the start of phase 3. This would provide the capability to establish biomarker status for all patients prior to randomization. Then during the phase 3 program, one would conduct stratified randomization (M+/M-) and have a clear plan for hypothesis testing that includes marker status (+/-) as well as adjustment for all other parameters of interest (e.g., dose, primary and key secondary endpoints).
The decision on the role of a biomarker in a development program will drive the hypothesis testing strategy. If the sponsor wants broad claim in the population of patients with the disorder, but would also like to claim as added benefit in M+ patients, hierarchical testing would likely begin in the broad population and then proceed to marker subgroups. Alternatively, the sponsor may recognize that a biomarker may “salvage” a program that might otherwise fail. In this case the testing hierarchy might reasonably begin testing with M+ patients and then move to M-.
In summary, regulatory agencies are not fundamentally opposed to considering alternative approaches to carving up the psychiatric illness space. However, there is a need to come prepared with strong arguments and data to support an alternative approach to diagnosing psychiatric illness. It is also helpful to have some reasonable consensus in the field in support of the alternative conceptualization. Furthermore, it is useful to note that robust findings in studies using the alternative approach that show convincing clinical benefits have a way of overcoming initial regulatory reluctance.
BIOLOGICAL DIFFERENTIATION OF DEPRESSION SUBTYPES: CORTISOL, INFLAMMATORY MARKERS, AND COURSE (F. Lamers)
Heterogeneity MDD. The known heterogeneity of MDD is hindering research, at the basic, clinical and therapeutic levels. The current classification systems based on descriptive phenomenology, not on etiology and pathophysiology, largely due to our lack of understanding of the latter. Though en face it would seem intuitively obvious that phenomenological heterogeneity should be the direct result of etiological heterogeneity, at this juncture this link has not been established empirically. Not taking into account heterogeneity of MDD could partially explain inconsistent findings as well as small effect sizes in clinical trials.
In the literature there are several starting points for the subtyping of MDD.[10] The first starting point is symptom-based, comprising the categories melancholic, psychotic (delusional), atypical, and anxious depression. Another approach is etiology-based, including adjustment disorder with depressed mood, early trauma, reproductive depression, perinatal depression, organic depression, and drug-induced depression. Finally there are the time-of-onset based categories (e.g., early vs. late onset, seasonal affective disorder).
To identify subtypes from a symptom-based perspective, a data-driven analysis (latent class analysis) was conducted within the Netherlands Study of Depression and Anxiety (NESDA). NESDA is a longitudinal naturalistic cohort study on the course and consequences of depression and anxiety,[11] and consists of 2,981 subjects (1,979 female and 1,002 male), aged 18 to 65 years, recruited in community, primary, and specialized care settings. The population comprises healthy controls, persons with depressive disorders (e.g., MDD, dysthymia), and persons with anxiety disorders (e.g., panic disorder, social phobia, agoraphobia, GAD). For the LCA, 818 persons with a diagnosis of MDD or minor depression were included.
The best fitting model was a three-class model. Based on symptom probabilities, the first group was labeled “severe melancholic” (prevalence 46.3%) and was characterized mainly by decreased appetite and weight loss, but also had the highest probabilities on suicidal thought, psychomotor changes, and lack of responsiveness. The second class was labeled “severe atypical” (24.6%) characterized mainly by overeating and weight gain, and with the highest probabilities of leaden paralysis and interpersonal sensitivity, and the third class was labeled “moderate” (29.1%) and was characterized by lower symptom probabilities and overall lower severity.[12]
Clinical characteristics only significantly differed between the moderate and the severe groups, with the moderate group having less comorbidity, less often had a positive family history and a shorter duration of the depression.[12] While the severe atypical and severe melancholic group did not differ in clinical characteristics, the melancholic group was significantly more likely to smoke than severe atypicals. Atypicals, on the other hand had significantly more metabolic disturbances than the severe melancholic class, as indicated by higher body mass index (BMI) and higher prevalence of metabolic syndrome.[12]
Neuroendocrine and inflammatory markers in depression. It has long been known that changes in the hypothalamic-pituitary-adrenal (HPA) axis may occur in major depression.[13] Adrenocorticotropic hormone (ACTH) alpha 1-24 infusion has been shown to cause significantly higher cortisol concentrations, with earlier peak responses, in patients with endogenous depression than in normal subjects.[14] At one point, the ACTH stimulation test was even proposed as a diagnostic for depression.[15]
More recently the concentrations of certain inflammatory markers have been found to be altered in depression.[16–18] The NESDA data collection also included biological measures such as salivary cortisol (cortisol awakening curve) and inflammatory markers C-reactive protein (CRP), interleukin-6 (IL-6), and tumor necrotic factor-alpha (TNF-a), and these were evaluated in MDD groups. Some differences in biomarker profiles were observed between patients with melancholic depression and patients with atypical depression. Vreeburg et al[19] had previously demonstrated within the NESDA sample that, as compared to controls, both patients in a current episode of MDD and those who had remitted had similarly elevated areas under the curves (AUC) for cortisol during the first hour after awakening. When Lamers et al[20] examined a group of NESDA participants divided into stable melancholic vs. stable atypical subtypes, they found that patients with stable melancholic depression had higher cortisol AUCs than either controls or patients with stable atypical depression, in line with the finding of a larger effect size for melancholic depression by Stetler et al.[13] Moreover, there was no difference between stable atypicals and controls.[20]
In NESDA participants with current MDD and remitted MDD as compared to healthy controls, CRP, TNF-a, and IL-6 levels were not significantly different.[21] However, when Lamers et al[20] compared these same three markers among melancholic depression, atypical depression and controls a very different picture emerged. Patients with atypical depression had elevated levels of CRP, TNF-a, and IL-6 compared to either melancholics or controls. Patients with melancholic depression did not differ from controls on any of these three measures. For an interesting review of recent findings on cortisol and inflammation from other studies over the last two decades see Penninx et al.[22]
Taken together, the data presented above suggest that the two different clinical entities of melancholic depression and atypical depression may result from distinct pathophysiologic processes. The pathophysiology of melancholic depression may be related to hyperactivity of the HPA-axis, smoking and even environmental stress, while that of atypical depression may be associated with increased inflammation, metabolic syndrome and obesity. These two entities may be the result of different genetic influences. This then begs the question, what might be the importance of these findings regarding treatment?
Clinical trial data appear to support the importance of this biological differentiation. Raison et al[23] conducted a 12-week randomized clinical trial of three infusions of TNF antagonist infliximab versus placebo in 60 out-patients with treatment-resistant depression (TRD) There was no difference between the two treatment groups, but when analyzed as a function of baseline hs-CRP concentration, there was a trend in favor of infliximab for those patients with higher baseline concentrations of CRP.[23]
In light of the above, one might well ask whether or not oral anti-inflammatory agents, such as cyclo-oxygenase (Cox) inhibitors may have a use as add-on therapy in MDD. A recent meta-analysis performed by Na et al[24] including four trials evaluating adjunctive celecoxib therapy in MDD showed that both changes from baseline in the 17-item HAM-D and remission rates after treatment favored adjunctive celecoxib.
To conclude, the take-home message is that the clinical characterization of atypical and melancholic depression can be regarded as a proxy for two groups with distinct biological characteristics. Given the variability of clinical ratings, the utilization of the characterized biological markers should even more sharply differentiate forms of depression with different response profiles. These data are in accordance with clinical data, which demonstrate that increased inflammatory markers (approximated by atypical clinical characteristics) on the one hand and increased HPA axis activity (approximated by melancholic characteristics) predict the efficacy of antidepressant compounds. Therefore, in designing any clinical trials program for MDD, it is important to take biological MDD heterogeneity into account by stratification for subgroups.
PHYSIOLOGICAL SENSOR TECHNOLOGY FOR OBJECTIVE CLINICAL DATA IN PSYCHIATRY (R. Picard)
In psychiatry there are few valid, reliable objective measures available to quantify disorders, but this situation is changing. Recent advances in physiological sensor technology can provide objective clinical data in a way that can now be utilized in large scale clinical trials. Autonomic nervous system activation, physical movement, temperature, and more can be measured using discreet portable sensors worn on the wrists or ankles. Both main branches of the autonomic nervous system can be measured: Sympathetic nervous system arousal elicits electrodermal activation (EDA), which can be measured as skin conductance using a comfortably wearable sensor. Parasympathetic nervous system arousal can be captured through analysis of the photoplethysmogram (PPG), also from the surface of the skin under a comfortable wearable band.
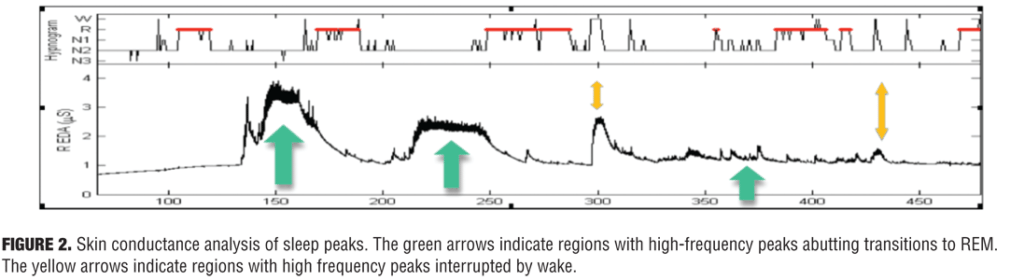
Autonomic arousal, which is affected by emotional state, can be measured in subjects going about their activities of daily life as well as during sleep. Striking patterns of arousal can be found, some of which are counter-intuitive. For example, EDA peaks often happen in bursts during non- rapid eye movement (REM) sleep: Sano and Picard have found that patterns of these peaks in the first and last quadrant of sleep are more accurate than EEG for determining which study subjects improved the most on a learning task during sleep, which relates to memory consolidation (Figure 2).[25]
A reasonable rationale exists for the use of bilateral EDA as objective measures in anxiety and depression. Stimulation of the left amygdala gives the most significant EDA response on the left palm; stimulation of the right amygdala gives the most significant EDA response on the right palm.[26] Direct right amygdala stimulation has been shown to contribute to significant increases in fear, anxiety, and sadness while direct left amygdala stimulation was not specific to these.[27]
There are additional reasons to consider bilateral EDA for objective measurement in anxiety and depression. Juranek et al[28] examined a group of 42 children who met criteria for autism spectrum disorders. They found a significant association between anxious and depressed symptoms and right amygdala volume, as assessed by quantitative MRI, but not with left amygdala volume. This finding is to be expected given the hypothesized greater right amygdala activation in anxiety and sadness. Monk et al[29] examined amygdala activation in a group of 17 youth with GAD, and a control sample of 12 youth with no psychiatric diagnosis. Subjects with GAD showed larger right amygdala activation when viewing masked angry faces but not masked neutral faces. The amount of right amygdala activation correlated positively with GAD severity.
As early as 1983, Ward et al[30] found that the mean resting skin conductance level (SCL) in 31 inpatients with major unipolar depression was decreased (2.63 ?S/cm2 +/- SD 1.41 compared to 7.81 ?S/cm2 +/- SD 3.0) in comparison in the control group. The best criterion below which an SCL could be considered abnormal was 4.3 ?S/cm2 with a resulting sensitivity of 87 percent and specificity of 89 percent. There was a significant difference in SCL between male and female subjects but none between drug-free and medicated patients. SCL was abnormal in all depression subtypes. Thus, the SCL may represent a biological final common pathway in depression and may prove to be a very effective diagnostic test for depression. Today these data can easily be collected in real-life activities, where extreme stressors occur, in contrast with traditional measures in labs, where patient behavior may not have fully reflected their behavioral range.
Among the reasons to examine EDA as an objective treatment measure in schizophrenia are that electrodermal response recovery rate has been shown to be an especially valid predictor in some risk studies of schizophrenia.[31,32] Other evidence shows disturbances in the hippocampus and amygdala in schizophrenics, structures that elicit EDA.[33] The recommendation, if there is believed to be involvement of the amygdala, hippocampus, or anterior cingulate, is to measure the EDA on both wrists, allowing significant asymmetries in activation to be detected. In general, studies that at one time were done in the lab, measuring only one side of EDA (usually the non-dominant side) can now be easily conducted over full days and weeks, on both sides of the body if desired. The results give a more complete and objective picture of autonomic activation and its variation in conditions of depression and schizophrenia. These measures have the potential to create objective and significant personalized characterizations of patient subgroups and their responses to treatment. Therefore, a specific activity pattern can be used to define subgroups which may respond preferably to a given compound. Moreover, changes in the activity pattern may be used as markers of target engagement and therefore necessary early response markers.
TARGET-BASED BIOMARKER SELECTION: Mineralocorticoid Receptor-Based Biomarkers and Treatment outcome in Depression (H. Murck)
It is generally considered that the era of modern psychopharmacology began in the 1950s with the introduction of antipsychotic and antidepressive medication. Imipramine, the parent compound of current antidepressants, was introduced in 1957. Following the observation of its clinical effect, hypothesis about the pathophysiology of depression were constructed around the known pharmacology of imipramine at the time. This led to the catecholamine hypothesis of depression,[34] which was most influential. However, besides the focus on monoamines two alternative biochemical hypotheses of depressive were clearly identified in the early years of modern biological psychiatry: the stress-hormone-hypothesis and the electrolyte-hypothesis.[35] Nevertheless, the monoamine hypothesis became the basis for most drug developments in the area of depression despite the fact, that the parent compound imipramine, whose pharmacology provided the basis for this hypothesis, has a much more complex pharmacology than being just a monoamine reuptake inhibitor.[36] The stress-hormone hypothesis focused on hypercortisolism, which can be identified in the most severe patients with depression,[37] whereas other stress hormones did not find much interest. The electrolyte hypothesis was mainly neglected for the last 50 years. This is despite the fact that a connection between the neuroendocrine changes of stress and electrolyte regulation was recognized earlier: In 1969 Coppen noted that “in view of the considerable disturbances in electrolyte distribution found in depression studies on aldosterone secretion would be most valuable.”[38]
A newer area of research, which is in good alignment with the potential importance of aldosterone in depression, is based on the observation of inflammatory changes in depression.[39] This link between inflammation and mineralocorticoids was recognized as early as in the 1950s by the founder of stress research.[40] Selye classified “prophlogistic” corticoids (PC), and identified those with the mineralocorticoids, such as aldosterone and “antiphlogistic” corticoids (AC), which he identified with glucocorticoids such as cortisol.
Despite the neglect of aldosterone as the principal ligand of the mineralocorticoid receptor (MR), this receptor itself was studied in the context of major depression: The expression of the mineralocorticoid (MR) receptors, but not the glucocorticoid receptors (GR) are reduced in the hippocampi of subjects who committed suicide.[41] Vice versa, the levels of expression of MR mRNA increased in the hippocampi of rats after chronic (8-weeks) treatment with antidepressant drugs. An increase was observed as early as two weeks.[42] Taken together, these data suggest that the MR is linked to depression. The role of aldosterone, which is its physiological ligand, has for a long time not been taken into account based on the belief that MRs within the brain are mostly occupied by corticosterone.
However, when comparing the levels of nocturnal HPA and RAAS hormones in depressed patients versus healthy controls, a significant elevations of aldosterone over the eight-hour course of the night was observed, with no such differences in renin and ACTH.[43] There was also a non-significant trend (p<0.10) for elevations in cortisol among depressed patients over the same period. This observation was independently replicated[44] and refined:[45] It appears that MDD patients with hypertension had elevated levels of aldosterone compared to both non-depressed hypertensive subjects as well as normotensive depressed subjects, which may point to a specificity of the overlap of both conditions as a correlate of hyperaldosteronism.
In light of the above observations, the question arises as to whether high aldosterone is a biomarker (as an epiphenomenon), or potentially causally involved in some forms of depression. Indirect evidence for a causal relationship comes from genetic studies: In a study of 273 patients with MDD, AT1- and ACE-polymorphisms predict outcome in antidepressant response.[46] In fact the genotypes, which are linked to a higher ACE and a higher AT1 activity and therefore a higher aldosterone level showed more therapy refractoriness. Unfortunately aldosterone itself was not determined in this study. Animal data support the role of aldosterone: subchronic administration of aldosterone with a minipump over a period of 3 weeks leads to depression- and anxiety like behavior,[47] which is accompanied with changed in hippocampal gene expression related to inflammation and glutamatergic transmission. All of these pathways have been recognized for their link to therapy refractory depression.
The physiologic consequences of aldosterone excess have been reviewed by Gomez-Sanchez.[48] Central effects include increased salt appetite, increased vasopressin release, decreased baroreceptor sensitivity, increased sympathetic drive and increases in the concentrations of pro-inflammatory cytokines. In the kidney one sees an increase in sodium and water reabsorption. Effects on the cardiovascular system include increased vascular tone and increased inflammation, which may similarly result in hypertrophy, necrosis and fibrosis. With this in mind aldosterone is a good candidate to explain the overlap between the risk of depression and that of cardiovascular disease.
In the current context it is important to state that there are known biomarkers for peripheral and central MR activity, based on the observation of their physiological effect: the MR agonist 11-deoxycorticosterone (DOC), a precursor of aldosterone, suppresses nocturnal cortisol secretion in healthy volunteers.[49] This is well in line with the known activity of the MR to suppress the HPA axis. Therefore the ratio of aldosterone and cortisol emerged as a reasonable marker for peripheral MR activity (this action is probably mediated at the level of the pituitary). Further, MR-antagonism with the CNS active compound canrenoate reduces slow wave sleep (SWS) in healthy controls[50] pointing to an increased SWS as a marker of high central MR activity. Further central markers for MR activity are heart rate variability and salt-liking, whereas blood pressure and electrolyte levels are additional peripheral markers. These markers were utilized in an observational study in patients with depression.[51] Measures were taken at Baseline, 2 weeks and 6 weeks. Parameters evaluated included 1) HAMD-6, HAMD-21, Quick Inventory of Depressive Symptomatology-self rated (QIDS-SR), and Beck’s Depression Inventory (BDI); 2) salivary aldosterone and salivary cortisol; 3) slow wave sleep; 4) heart rate, heart rate variability, and blood pressure; and 5) salt taste test. Aldosterone and cortisol were determined by means of saliva collection after awakening. In the pooled total dataset, which include data from all visits, salivary aldosterone correlated with depression severity as measured by HAMD-21. Furthermore, the aldosterone/cortisol ratio at baseline was found to predict the improvement in depression during the treatment period. Furthermore, cortisol reduction at Week 2 was found to be predictive for depression severity at outcome. Some of the findings were limited to male gender: improvement in HAMD-21 score at the final visit was inversely correlated with heart rate variability at baseline. Clinical improvement also correlated inversely with slow wave sleep at baseline as well as with plasma Na+ concentrations at baseline. The data are in line with a peripheral MR resistance in therapy refractory patients, which was recently confirmed by a neuroendocrine challenge.[52] The peripheral MR desensitization appears to correlate with a reactive peripheral aldosterone increase and as a consequence a central MR overactivity.
This mechanism suggests that some patients may benefit from treatment with centrally active MR antagonists and potentially peripheral agonists.[39] Preliminary data indeed suggest that MR antagonists have beneficial effects on affective symptoms. In a crossover-design study,[53] spironolactone decreased irritability, depression, food craving, and pain in patients with premenstrual syndrome. Additionally, drospirenone, a MR antagonist, is approved for the treatment of premenstrual dysphoric syndrome and has been shown to decrease depressive mood[54] in the population with this disease.
From the data discussed above, one may conclude that several inexpensive and easy to handle markers exist for the characterization of mineralocorticoid-function. MR-related parameters appear to be predictive markers for clinical outcome of depression treated with standard of care medication (e.g., mainly serotonin based therapies).[39] Therefore, easily available markers, which are related to MR function, can select patients likely to be refractory to standard of care.
ACTIGRAPHIC MONITORING OF PHYSICAL ACTIVITY IN CLINICAL TRIALS IN SCHIZOPHRENIA
(S. Walther)
Physical activity in schizophrenia is linked to the psychopathology, as are obesity, medication use, and lifestyle choices. Daytime actigraphy, with the actigraph strapped to the non-dominant wrist, can provide a useful measure of physical activity. This is in contrast to the typical nocturnal use for sleep studies. Linking daytime actigraphy and neuroimaging has been informative on neural correlates of motor behavior.[55]
Behavior and symptoms. Not surprisingly, hypokinesia and obesity in schizophrenic patients are linked.[56] The sedentary behaviors, which result in less than optimal exercise habits, are related to poor health-related quality of life.[57] Furthermore, hypokinesia is associated with negative syndrome: the Positive and Negative Syndrome Scale (PANSS) and even more so the PANSS avolition subscore correlate with reduced physical activity.[58,59] In fact, studies in chronic patients reported the strongest correlations between hypokinesia and negative symptoms. Overall movement patterns change as a function of clinical presentation, with irregular patterns associated with positive syndrome and disorganization, and reduced activity seen with negative syndrome.[60]
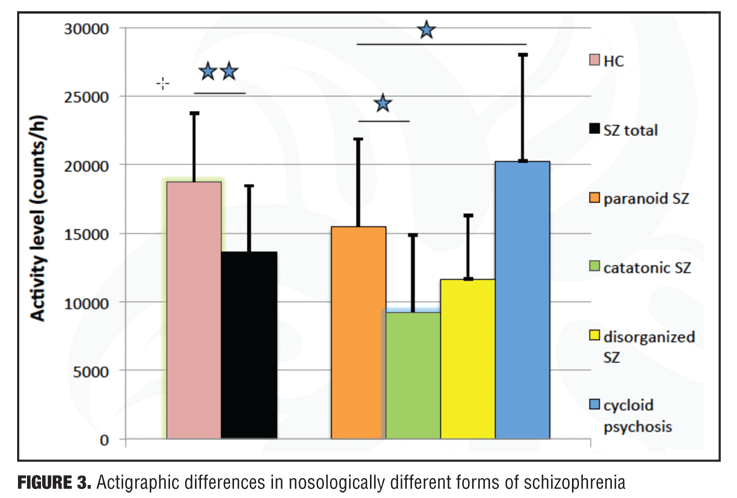
Nosological subgroups. As has already been discussed, patients with schizophrenia overall tend to move less than do healthy controls. However, there is heterogeneity in activity level across nosological subgroups.[58,61,62]
Patients who are catatonic have the lowest activity levels, in contrast to patients with cycloid psychosis and paranoia, who have the highest.[58,62,63] In addition, catatonic patients endorse longer periods of immobility (Figure 3).
Medication effects. In general, the effect of antipsychotic medications on activity levels is complex. Cross-sectional studies yielded inconclusive results. In chronic patients no differences were noted in activity levels between risperidone and olanzapine treatment.[64] However, in more acute patients olanzapine and risperidone seemed to differ slightly.[65] Still, the major difference may stem from heterogeneity in patient groups: While in a large sample of mixed chronicity, the chlorpromazine equivalents were unrelated to physical activity[66] and higher antipsychotic doses in the first episode were linked to low activity levels (Walther et al, unpublished data). This suggests that first episode patients might be particularly vulnerable to antipsychotic dosage, with other factors but medication contributing to hypokinesia in chronic patients. However, to tease out the effects of antipsychotics on activity levels, longitudinal studies with actigraphy and standardized treatment are necessary, ideally taking chronicity into account. As with other motor signs, we would expect that depending on the baseline measures there will be patients in whom medication would ameliorate hypokinesia and others who would experience negative effects by antipsychotics.[67]
Longitudinal course. When the activity levels of patients at the beginning of an acute psychotic episode are compared to those at the end of said episode, overall there appears to be no trend. High activity at baseline predicts high activity at end and low activity at baseline predicts low activity at end. However, patients with low activity levels at baseline present with high baseline PANSS negative scores, which will then decline over the course of treatment. On the other hand, patients with high activity levels at baseline tend to have low PANSS negative scores that remain stable over the course of the episode (Walther et al. unpublished data). Also between episodes, activity levels tend to remain stable, particularly in those patients who already have low activity levels and increased negative symptoms.
When the longitudinal course between episodes is examined, a high activity level at the index episode predicts an increase in PANSS negative score in later episodes, accompanied by a decrease in activity level.
In summary, physical activity as measured by actigraphy may indicate the severity and course of negative symptoms, as well as lifestyle choices and nosological entities among patients with schizophrenia spectrum disorders. When considering the potential value of actigraphy in clinical trials of treatments for schizophrenia, a major benefit is that large, objective datasets allow for centralized analysis. The application of actigraphy is simple and well tolerated. The procedure also tolerates missing values reasonable well. The added value is in continuous recording of activity and circadian rhythms. This in combination with experience based sampling enables a focus on disease trajectories. Among the problems are that more details are needed, including prospective assessment of medication and occupational status. Furthermore, there is a need for additional patient self-report (which is not always reliable) and activity/sleep protocol.
The putative value of actigraphy in clinical trials lies in the ability to 1) identify subgroups (e.g., low/high physical activity, nosological subgroups); 2) monitor dimensions, such as negative syndrome and abnormal motor behavior; and 3) use as an outcome marker of physical activity, avolition, and quality of life. In addition, actigraphy could serve as a simple marker of target engagement, depending in the property of the compound of interest.
THE USE OF BIOMARKERS IN CLINICAL TRIALS OF SCHIZOPHRENIA (D. Goff)
Biomarkers traditionally reflect specific drug targets based on illness models or drug mechanisms, or they provide information about drug metabolism. While a drug’s primary mechanism of action or its metabolism may be captured by relatively simple assays, illness models increasingly posit complex network dysregulation or impairment of plasticity. To represent these complex models may require much more sophisticated approaches than have been employed in the past. Potential roles for biomarkers in clinical trials includes establishing target engagement in order to guide dosing, measuring CNS activity as a means of monitoring therapeutic response, and subtyping patients according to likelihood of response in order to enhance sensitivity for detecting drug effects and ultimately to guide a personalized medicine approach. Despite over a decade of research, very few commercial biomarkers are available for clinicians treating schizophrenia. Most characterize hepatic CYP 450 isoenzymes to predict drug metabolism. Others have been developed to predict therapeutic response to clozapine or risk for agranulocytosis or metabolic side effects, but these biomarkers remain of unclear clinical utility.
A major problem faced by investigators working with “big data” approaches to biomarker development, such genome-wide association studies (GWAS) and the “omics” (e.g., metabolomics, proteomics, methylomics) is the risk of false positive findings and a corresponding failure to replicate positive results. One example of an approach to overcome these concerns is the finding by Malholtra et al in which single nucleotide polymorphisms (SNPs) associated with antipsychotic weight gain in a GWAS discovery sample were then subjected to three replication cohorts before identifying a single SNP as a potential biomarker.[68] In another example of genetic biomarkers, Roffman et al followed up on a previous report of a relationship between low serum folate concentrations and negative symptoms[69] and demonstrated an association between negative symptoms and a gene that regulates activity of methylene tetrahydrofolate reductase (MTHFR), an enzyme required for folate to participate in methylation reactions.[70] In a subsequent placebo-controlled clinical trial, folate supplementation was without benefit in the full sample, but associated with significant improvement of negative symptoms when subjects were categorized according to the MTHFR genetic marker.[71] Subsequent investigation of genes involved in the folate pathway, including absorption, metabolism (activation), and methylation function identified five genes that, when combined, better predict negative symptoms.[72] The five SNPS identified by Roffman and colleagues were subsequently demonstrated to predict response to folate supplementation in a larger replication trial.[73] While the focus increasingly is on GWAS and other “big data” approaches, this finding serves as a model of a hypothesis-driven approach to biomarker discovery. Using a different strategy, Zhang et al[74] examined 74 candidate genes in 279 subjects from the Clinical Antipsychotic Trials of Intervention Effectiveness study (CATIE) cohort using clozapine therapy as a proxy for treatment resistance. They then found that three BDNF SNPS were associated with this marker for treatment resistance, providing compelling evidence for BDNF genotype as a potential predictive biomarker.
Neuroimaging provides an increasingly important measure of brain structure or activity that may provide a more sensitive marker for target engagement and treatment impact on brain function than behavioral response. Most current work is examining functional MRI or PET as biomarkers;[75,76] however, imaging markers of brain structure may also provide information about treatment effects. In one example, Eack et al[77] monitored regional gray matter volume during a two-year study of cognitive enhancement therapy in participants with early stage schizophrenia and found significant effects suggestive of neuroprotection or enhancement of neuroplasticity. This effect was significant in the amygdala, fusiform gyrus, hippocampus and parahippocampal gyrus.
With the exception of CSF and imaging markers, most biomarkers under development are assays of components of peripheral blood. The value of peripheral measures remains debated, since it is unclear the degree to which many candidate markers reflect CNS status. Depending on several factors, some blood markers establish an equilibrium with CSF by readily crossing the blood brain barrier and are therefore more likely to be informative. Also, there is some “leakage” between blood and CSF of substances that are not usually considered as permeant, particularly under conditions of inflammation. BDNF is an example of a peripheral marker that has been reported to differ between patient samples and healthy controls and to predict treatment response, despite debate about whether the origins of peripheral BDNF are from CNS or peripheral sources, such as platelets. To address this issue, Pillai et al[78] measured peripheral and CSF BDNF concentrations and found a significant correlation coefficient of r=0.51. In general, demonstration of a significant relationship between peripheral and CNS concentrations or activity strengthens a claim for the potential utility of peripheral biomarker candidates. An additional argument for certain peripheral markers, such as lymphocytes or fibroblasts, is that they may mirror cells in the CNS. Several studies have reported strong associations between markers obtained from these peripheral cells and CNS. In one notable example, Mondelli et al[79] found that expression in lymphocytes of BDNF and the inflammatory cytokine, IL-6, accounted for 73 percent of the variance in left hippocampal volume in unmedicated patients with first episode psychosis. Salivary cortisol concentrations further increased the predictive value. While replication will be important, this study also illustrates the approach of sampling factors known to influence brain development and function, in this case inflammation, stress, and growth factors. Consistent with this model, Chan et al[80] recently reviewed 185 publications that reported 273 peripheral biomarkers in schizophrenia plus 7 multi-center studies that identified 137 blood biomarkers. The authors of this review similarly concluded that markers related to inflammation, cortisol and growth factors were most strongly implicated in schizophrenia and were most promising as predictors of treatment response.
Additional strategies have recently shown promise for the identification of potential biomarkers. Employing a proteomics approach, Schwarz et al[81] screened 181 proteins in blood from 250 medication-naïve first episode psychosis subjects compared to healthy controls. They found that a combination of 34 analytes correctly identified 75% of cases: these analytes primarily represented inflammatory, hormonal, metabolic, and neurotrophic factors. Aberg et al82 examined epigenetic factors by performing a methylome-wide association study in 759 individuals with schizophrenia and in matched healthy controls. They examined 68 million methylation sites per subject and performed an independent replication. Methylation signals that differentiated patients from controls were found in networks associated with neuronal differentiation of DA cells, hypoxia, inflammation and reelin.
In summary, traditional approaches to biomarkers have found little clinical application in schizophrenia. Recent advances in PET ligands and fMRI may facilitate early drug development. “Big data” is driving more complex models of illness and identifying networks of potential novel biomarkers. While peripheral biomarkers are of less certain validity in reflecting the CNS due to the blood brain barrier, several approaches have produced promising results. New biomarkers based on inflammation, stress, and neurodevelopmental factors may be of particular value for drug development in prodrome and early stages of the illness.
A combination of peripheral markers may therefore support the proper diagnosis of schizophrenia and provide the basis of a more biologically homogeneous patient selection. The outcome of clinical trials would be dramatically de-risked on the basis of a lesser biological variability of the enrolled subjects.
Conclusion
Biomarkers can be utilized for a variety of purposes in different contexts. The understanding of the conceptual differentiation between these different modes is one important obstacle for their use. An overview is provided in Table 1.[5–8]

The main objective of the utilization of biomarkers in the current context is firstly, a means to identify the right patient (i.e., to define differential markers to classify patients into biomarker positive and biomarker negative groups for patient stratification, and finally, selection). These potentially predictive markers may or may not change with treatment (in contrast to hypothetical surrogate markers, which is expected to change with clinical improvement). We saw that predictive markers can be genetic, physiological or biochemical markers as well as markers of a clinically defined subgroup. Accomplishing such a goal will necessitate careful pilot work and then hypothesis testing in definitive trials to demonstrate and replicate differential efficacy. Biomarkers demonstrated to be useful may be permitted into labeling, provided that practical methods are available for identifying relevant patient subgroups. Future biomarkers may permit the sub-grouping of heterogeneous populations into responsive and non-responsive sub-types. The definition of a patient population on the basis of biological criteria would at the same time overcome the diagnostic uncertainty, which many trials may face, as “professional” patients may try to get enrolled.
The second objective, pointing to the issue of the right dose, is the question of target engagement. Functional markers for nearly any CNS active compound can be derived from its mechanism of action and independent of any assumptions of disease biology. These can be assessed shortly after the beginning of drug administration and have their value as necessary markers for response and may support the prediction of long term outcome. These markers could in addition be of interest for the individualized titration in a given subject.
There are several important aspects, which have to be stressed for the success of this path. One is that the technical validity for a marker has to be convincingly demonstrated before its use. This is given for the examples in this overview. The clinical and regulatory validity comes out of the demonstration that biomarker positive and biomarker negative subgroups behave differently with regard to the treatment outcome with a specific compound. As long as this differentiation was pre-specified it can be utilized for regulatory purposes. This is a path to personalized medicine, which is technically feasible and necessary for the success of CNS drug development in the future. With this focused approach the goal of developing new compounds, which are superior to standard of care, can and must be achieved.
Acknowledgments
The authors would like to thank Rolando Gutierrez-Esteinou and Kevin Craig, both at Covance, for their helpful comments.
References
1. Hurko O, Ryan JL. Translational research in central nervous system drug discovery. NeuroRx. 2005;2:671–682.
2. Cook D, Brown D, Alexander R, et al. Lessons learned from the fate of AstraZeneca’s drug pipeline: a five-dimensional framework. Nat Rev Drug Discov. 2014;13:419–431.
3. Miresco MJ, Kirmayer LJ. The persistence of mind-brain dualism in psychiatric reasoning about clinical scenarios. Am J Psychiatry. 2006;63:913–918.
4. Biomarkers Definitions Working G. Biomarkers and surrogate endpoints: preferred definitions and conceptual framework. Clin Pharmacol Therapeut. 2001;69:89–95.
5. Binder EB, Salyakina D, Lichtner P, et al. Polymorphisms in FKBP5 are associated with increased recurrence of depressive episodes and rapid response to antidepressant treatment. Nat Genet. 2004;36:1319–1325.
6. Horstmann S, Lucae S, Menke A, et al. Polymorphisms in GRIK4, HTR2A, and FKBP5 show interactive effects in predicting remission to antidepressant treatment. Neuropsychopharmacology. 2010;35:727–740.
7. Baghai TC, Binder EB, Schule C, et al. Polymorphisms in the angiotensin-converting enzyme gene are associated with unipolar depression, ACE activity and hypercortisolism. Mol Psychiatry. 2006;11:1003–1015.
8. Murck H, Nickel T, Künzel H, et al. State markers of depression in sleep EEG: dependency on drug and gender in patients treated with tianeptine or paroxetine. Neuropsychopharmacology. 2003;28(2):348–358.
9. Yuste R, Church GM. The new century of the brain. Scientific American. 2014;310:38–45.
10. Baumeister H, Parker G. Meta-review of depressive subtyping models. J Affect Disord. 2012;139:126–140.
11. Penninx BW, Beekman AT, Smit JH, et al. The Netherlands Study of Depression and Anxiety (NESDA): rationale, objectives and methods. Int J Methods Psychiatr Res. 2008;17:121–140.
12. Lamers F, de Jonge P, Nolen WA, et al. Identifying depressive subtypes in a large cohort study: results from the Netherlands Study of Depression and Anxiety (NESDA). J Clin Psychiatry. 2010;71:1582–1589.
13. Stetler C, Miller GE. Depression and hypothalamic-pituitary-adrenal activation: a quantitative summary of four decades of research. Psychosom Med. 2011;73:114–126.
14. Amsterdam JD, Lucki I, Winokur A. The ACTH stimulation test in depression. Psychiatr Med. 1985;3:91–100.
15. Sher L, Oquendo MA, Burke AK, et al. Combined dexamethasone suppression-corticotrophin-releasing hormone stimulation test in medication-free major depression and healthy volunteers. J Affect Disord. 2013;151:1108–1112.
16. Howren MB, Lamkin DM, Suls J. Associations of depression with C-reactive protein, IL-1, and IL-6: a meta-analysis. Psychosom Med. 2009;71:171–186.
17. Dowlati Y, Herrmann N, Swardfager W, et al. A meta-analysis of cytokines in major depression. Biol Psychiatry. 2010;67:446–457.
18. Hiles SA, Baker AL, de Malmanche T, Attia J. A meta-analysis of differences in IL-6 and IL-10 between people with and without depression: exploring the causes of heterogeneity. Brain Behav Immun. 2012;26:1180–1188.
19. Vreeburg SA, Kruijtzer BP, van Pelt J, et al. Associations between sociodemographic, sampling and health factors and various salivary cortisol indicators in a large sample without psychopathology. Psychoneuroendocrinology. 2009;34:1109–1120.
20. Lamers F, Vogelzangs N, Merikangas KR, et al. Evidence for a differential role of HPA-axis function, inflammation and metabolic syndrome in melancholic versus atypical depression. Mol Psychiatry. 2013;18:692–699.
21. Vogelzangs N, Duivis HE, Beekman AT, et al. Association of depressive disorders, depression characteristics and antidepressant medication with inflammation. Transl Psychiatry. 2012;2:e79.
22. Penninx BW, Milaneschi Y, Lamers F, Vogelzangs N. Understanding the somatic consequences of depression: biological mechanisms and the role of depression symptom profile. BMC Med. 2013;11:129.
23. Raison CL, Rutherford RE, Woolwine BJ, et al. A randomized controlled trial of the tumor necrosis factor antagonist infliximab for treatment-resistant depression: the role of baseline inflammatory biomarkers. JAMA Psychiatry. 2013;70:31–41.
24. Na KS, Lee KJ, Lee JS, et al. Efficacy of adjunctive celecoxib treatment for patients with major depressive disorder: a meta-analysis. Prog Neuropsychopharmacol Biol Psychiatry. 2014;48:79–85.
25. Sano A, Picard RW. Toward a taxonomy of autonomic sleep patterns with electrodermal activity. Conf Proc IEEE Eng Med Biol Soc. 2011;777–780.
26. Mangina CA, Beuzeron-Mangina JH. Direct electrical stimulation of specific human brain structures and bilateral electrodermal activity. Int J Psychophysiol. 1996;22:1–8.
27. Lanteaume L, Khalfa S, Regis J, et al. Emotion induction after direct intracerebral stimulations of human amygdala. Cereb Cortex. 2007;17:1307–1313.
28. Juranek J, Filipek PA, Berenji GR, et al. Association between amygdala volume and anxiety level: magnetic resonance imaging (MRI) study in autistic children. J Child Neurol. 2006;21:1051–1058.
29. Monk CS, Telzer EH, Mogg K, et al. Amygdala and ventrolateral prefrontal cortex activation to masked angry faces in children and adolescents with generalized anxiety disorder. Arch Gen Psychiatry. 2008;65:568–576.
30. Ward NG, Doerr HO, Storrie MC. Skin conductance: a potentially sensitive test for depression. Psychiatry Res. 1983;10:295–302.
31. Venables PH. The Emanuel Miller memorial lecture 1987. Childhood markers for adult disorders. J Child Psychol Psychiatry. 1989;30(3):347–364.
32. Boucsein W. Electrodermal Activity, Second Edition. New-York: Springer-Verlag; 2012.
33. Venables PH. Some Problems and Controversies in the Psychophysiological Investigation of Schizophrenia. London: A. Gale & J A Edwards; 1983.
34. Schildkraut JJ. The catecholamine hypothesis of affective disorders: a review of supporting evidence. Am J Psychiatry. 1965;122:509–522.
35. Coppen A. The biochemistry of affective disorders. Br J Psychiatry. 1967;113:1237–1264.
36. Murck H. Ketamine, magnesium and major depression—from pharmacology to pathophysiology and back. J Psychiatr Res. 2013;47:955–965.
37. Holsboer F. Psychiatric implications of altered limbic-hypothalamic- pituitary-adrenocortical activity. Eur Arch Psychiatry Neurol Sci. 1989;238:302–322.
38. Coppen A. Electrolytes and mental illness. Proc Annu Meet Am Psychopathol Assoc. 1969;58:397–409.
39. Murck H, Schussler P, Steiger A. Renin-angiotensin-aldosterone system: the forgotten stress hormone system: relationship to depression and sleep. Pharmacopsychiatry. 2012;45:83–95.
40. Selye H. Endocrine reactions during stress. Curr Res Anesth Analg. 1956;35:182–193.
41. Lopez JF, Chalmers DT, Little KY, Watson SJ. A.E. Bennett Research Award. Regulation of serotonin1A, glucocorticoid, and mineralocorticoid receptor in rat and human hippocampus: implications for the neurobiology of depression. Biol Psychiatry. 1998;43:547–573.
42. Brady LS, Gold PW, Herkenham M, et al. The antidepressants fluoxetine, idazoxan and phenelzine alter corticotropin-releasing hormone and tyrosine hydroxylase mRNA levels in rat brain: therapeutic implications. Brain Res. 1992;572:117–125.
43. Murck H, Held K, Ziegenbein M, et al. The renin-angiotensin-aldosterone system in patients with depression compared to controls–a sleep endocrine study. BMC Psychiatry. 2003;3:15.
44. Emanuele E, Geroldi D, Minoretti P, et al. Increased plasma aldosterone in patients with clinical depression. Arch Med Res. 2005;36:544–548.
45. Hafner S, Baumert J, Emeny RT, et al. Hypertension and depressed symptomatology: a cluster related to the activation of the renin-angiotensin-aldosterone system (RAAS). Findings from population based KORA F4 study. Psychoneuroendocrinology. 2013;38(10):2065–2074.
46. Bondy B, Baghai TC, Zill P, et al. Genetic variants in the angiotensin I-converting-enzyme (ACE) and angiotensin II receptor (AT1) gene and clinical outcome in depression. Prog Neuropsychopharmacol Biol Psychiatry. 2005;29:1094–1099.
47. Hlavacova N, Wes PD, Ondrejcakova M, et al. Subchronic treatment with aldosterone induces depression-like behaviours and gene expression changes relevant to major depressive disorder. Int J Neuropsychopharmacol. 2012;15:247–265.
48. Gomez-Sanchez EP. Mineralocorticoid receptors in the brain and cardiovascular regulation: minority rule? Trends Endocrinol Metab. 2011;22:179–187.
49. Steiger A, Rupprecht R, Spengler D, et al. Functional properties of deoxycorticosterone and spironolactone: molecular characterization and effects on sleep-endocrine activity. J Psychiatr Res. 1993;27:275–284.
50. Born J, De Kloet ER, Wenz H, et al. Gluco- and antimineralocorticoid effects on human sleep: a role of central corticosteroid receptors. Am J Physiol. 1991;260:E183–E188.
51. Buettner M, Jezova D, Konrad C, et al. Central and peripheral mineralocorticoid receptor function and its impact on the course of depression. Biol Psychiatry. 2014; 75:114S.
52. Juruena MF, Pariante CM, Papadopoulos AS, et al. The role of mineralocorticoid receptor function in treatment-resistant depression. J Psychopharmacol. 2013;27:1169–1179.
53. Wang M, Hammarback S, Lindhe BA, Backstrom T. Treatment of premenstrual syndrome by spironolactone: a double-blind, placebo-controlled study. Acta Obstet Gynecol Scand. 1995;74:803–808.
54. Yonkers KA, Brown C, Pearlstein TB, et al. Efficacy of a new low-dose oral contraceptive with drospirenone in premenstrual dysphoric disorder. Obstet Gynecol. 2005;106:492–501.
55. Walther S, Strik W. Motor symptoms and schizophrenia. Neuropsychobiology. 2012;66:77–92.
56. Vancampfort D, Probst M, Sweers K, et al. Relationships between obesity, functional exercise capacity, physical activity participation and physical self-perception in people with schizophrenia. Acta Psychiatr Scand. 2011;123:423–430.
57. Brown S, Birtwistle J, Roe L, Thompson C. The unhealthy lifestyle of people with schizophrenia. Psychol Med. 1999;29:697–701.
58. Walther S, Horn H, Razavi N, et al. Quantitative motor activity differentiates schizophrenia subtypes. Neuropsychobiology. 2009b;60:80–86.
59. Docx L, Sabbe B, Provinciael P, et al. Quantitative psychomotor dysfunction in schizophrenia: a loss of drive, impaired movement execution or both? Neuropsychobiology. 2013;68:221–227.
60. Walther S, Ramseyer F, Horn H, et al. Less structured movement patterns predict severity of positive syndrome, excitement, and disorganization. Schizophr Bull. 2014;40:585–591.
61. Walther S, Federspiel A, Horn H, et al. Alterations of white matter integrity related to motor activity in schizophrenia. Neurobiol Dis. 2011;42:276–283.
62. Walther S, Horn H, Koschorke P, et al. Increased motor activity in cycloid psychosis compared to schizophrenia. World J Biol Psychiatry. 2009;10:746–751.
63. Walther S, Koschorke P, Horn H, Strik W. Objectively measured motor activity in schizophrenia challenges the validity of expert ratings. Psychiatry Res. 2009c;169:187–190.
64. Wichniak A, Skowerska A, Chojnacka-Wojtowicz J, et al. Actigraphic monitoring of activity and rest in schizophrenic patients treated with olanzapine or risperidone. J Psychiatr Res. 2011;45:1381–1386.
65. Walther S, Horn H, Razavi N, et al. Higher motor activity in schizophrenia patients treated with olanzapine versus risperidone. J Clin Psychopharmacol. 2010;30:181–184.
66. Bracht T, Heidemeyer K, Koschorke P, et al. Comparison of objectively measured motor behavior with ratings of the motor behavior domain of the Bern Psychopathology Scale (BPS) in schizophrenia. Psychiatry Res. 2012;198:224–229.
67. Peralta V, Cuesta MJ. The effect of antipsychotic medication on neuromotor abnormalities in neuroleptic-naive nonaffective psychotic patients: a naturalistic study with haloperidol, risperidone, or olanzapine. Prim Care Companion J Clin Psychiatry. 2010;12.
68. Malhotra AK, Correll CU, Chowdhury NI, et al. Association between common variants near the melanocortin 4 receptor gene and severe antipsychotic drug-induced weight gain. Arch Gen Psychiatry. 2012;69:904–912.
69. Goff DC, Bottiglieri T, Arning E, et al. Folate, homocysteine, and negative symptoms in schizophrenia. Am J Psychiatry. 2004;161:1705–1708.
70. Roffman JL, Weiss AP, Purcell S, et al. Contribution of methylenetetrahydrofolate reductase (MTHFR) polymorphisms to negative symptoms in schizophrenia. Biol Psychiatry. 2008;63:42–48.
71. Hill M, Shannahan K, Jasinski S, et al. Folate supplementation in schizophrenia: a possible role for MTHFR genotype. Schizophr Res. 2011;127:41–45.
72. Roffman JL, Brohawn DG, Nitenson AZ, et al. Genetic variation throughout the folate metabolic pathway influences negative symptom severity in schizophrenia. Schizophr Bull. 2013;39(2):330–338.
73. Roffman JL, Lamberti JS, Achtyes E, et al. Randomized multicenter investigation of folate plus vitamin B12 supplementation in schizophrenia. JAMA Psychiatry. 2013 May;70(5):481–489.
74. Zhang JP, Lencz T, Geisler S, et al. Genetic variation in BDNF is associated with antipsychotic treatment resistance in patients with schizophrenia. Schizophr Res. 2013;146:285–288.
75. Castellanos FX, Di Martino A, Craddock RC, et al. Clinical applications of the functional connectome. NeuroImage. 2013;80:527–540.
76. McGrath CL, Kelley ME, Holtzheimer PE, et al. Toward a neuroimaging treatment selection biomarker for major depressive disorder. JAMA Psychiatry. 2013;70:821–829.
77. Eack SM, Hogarty GE, Cho RY, et al. Neuroprotective effects of cognitive enhancement therapy against gray matter loss in early schizophrenia: results from a 2-year randomized controlled trial. Arch Gen Psychiatry. 2010;67:674–682.
78. Pillai A, Kale A, Joshi S, et al. Decreased BDNF levels in CSF of drug-naive first-episode psychotic subjects: correlation with plasma BDNF and psychopathology. Int J Neuropsychopharmacol. 2010;13:535–539.
79. Mondelli V, Cattaneo A, Belvederi Murri M, et al. Stress and inflammation reduce brain-derived neurotrophic factor expression in first-episode psychosis: a pathway to smaller hippocampal volume. J Clin Psychiatry. 2011;72:1677–1684.
80. Chan MK, Guest PC, Levin Y, et al. Converging evidence for blood-based biomarkers in schizophrenia: an update. Int Rev Neurobiol. 2001;101:95–144.
81. Schwarz E, Guest PC, Steiner J, et al. Identification of blood-based molecular signatures for prediction of response and relapse in schizophrenia patients. Transl Psychiatry. 2012;2:e82.
82. Aberg KA, McClay JL, Nerella S, et al. Methylome-wide association study of schizophrenia: identifying blood biomarker signatures of environmental insults. JAMA Psychiatry. 2014;71:255–264.