

by Plamen Tzvetanov, MD, Phd, DSc, FRCP; Ivan Lisichkov, MD, PhD; Rossen T. Rousseff MD, PhD; Vishwajit Hegde, MD, FRCP; and Sergey Kostadinov, MD, PhD
Prof. Tzvetanov is with the Department of Clinical Neurophysiology, Broomfield Hospital Mid Essex Hospital Trust in Broomfield, United Kingdom. Dr. Lisichkov is with the Department of Neurology, Multiprofile Hospital for Active Treatment of Russe in Ruse, Bulgaria. Dr. Rousseff is with the Medical University of Pleven, Bulgaria. Dr. Hegde is a Consultant Neurologisy and Neurophysiologist, University Hospitals of Coventry and Warwickshire in Conventry, United Kingdom. Dr. Kostadinov is an Assistant Professor, Department of General Medicine, Forensic Medicine and Deontology, Faculty of Public Health, Medical University in Pleven, Bulgaria.
Funding: No funding was provided for this study.
Disclosures: The authors have no conflicts of interest relevant to the contents of this article.
Innov Clin Neurosci. 2022;19(7–9):71–76.
abstract
Objective: We sought to assess the influence of Parkinson’s disease (PD) on contingent negative variation (CNV).
Patients and Methods: This prospective study included 49 patients with PD (69.7±16.5; 35 male) and 35 age- and sex-matched controls. The PD cohort was subdivided, according to the Hoehn-Yahr Scale, Unified Parkinson’s Disease Rating Scale (UPDRS), and UPDRS Part III, into 30 cases of uncomplicated PD and 19 cases of advanced PD. CNV was recorded over the frontal and central vertex with a linked bimastoid reference using a dual-stimulus paradigm with interstimulus intervals (ISIs) of 1.7 and 2.0 seconds.
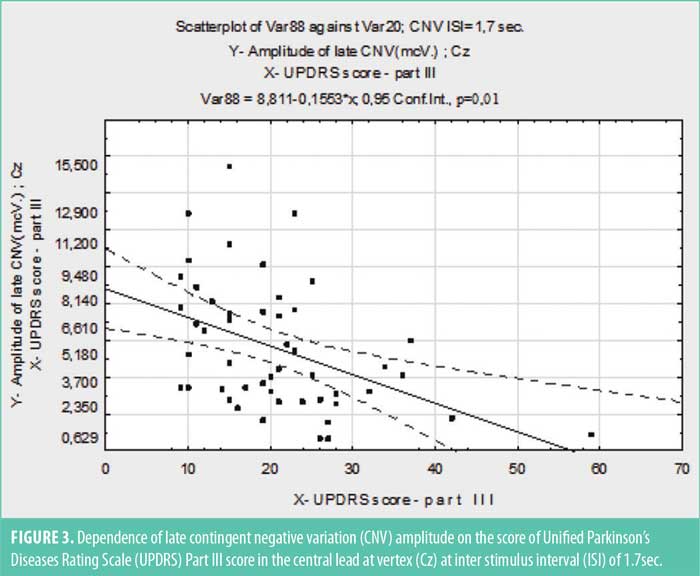
Results: In advanced PD, the amplitude of the late CNV over the central vertex was markedly reduced (p<0.005) at ISI of 1.7 seconds and correlated negatively with UPDRS (r=–0.32; p<0.003) and motor score (UPDRS Part III) (r=–0.45; p<0.002).
Conclusion: Late CNV amplitude was significantly abnormal in PD and correlated with the severity of the motor manifestations.
Keywords: CNV, slow cortical potentials, Parkinson’s disease
A complex and intricate interaction between the basal ganglia and cerebral cortex underlies the preparation and execution of voluntary movements. Neuroimaging techniques, especially functional magnetic resonance imaging (fMRI), positron emission tomography (PET), and single photon emission computed tomography (SPECT), provide accurate spatial neuroanatomic pictures of changes in metabolic neuronal activity and mediator systems in movement disorders. However, temporal resolution of these imaging technologies is low, detecting changes over a time scale of minutes.1–4 In contrast, slow cortical potentials, such as contingent negative variation (CNV)4 and readiness potential (Bereitschaftspotential; BP),5 assess the changes in cortical activity related to mental and motor performance-related tasks with temporal resolution of seconds to milliseconds.6–8
Reduction in amplitude of the early BP component4,5 and late CNV component9,10 in patients with movement disorders was reported in earlier studies, but the correlation between neurophysiological abnormality and Parkinson’s disease (PD) severity and clinical features remains less well-established and controversial.
We studied the correlation of PD severity, duration, and clinical features with CNV parameters, comparing patients with advanced PD to age- and sex-matched cohorts of patients with early PD and healthy controls.
Patients and Methods
This study included 84 patients with PD from the outpatient neurology clinic of a tertiary care hospital between the years of 2009 and 2019 and 35 healthy age- and sex- matched controls. Informed consent was obtained from all study subjects. PD was diagnosed according to the United Kingdom (UK) Parkinson’s Disease Society Brain Bank clinical diagnostic criteria for PD.11 Excluded from recruitment were four patients, one with progressive supranuclear palsy, one with essential tremor, and two with subtle extrapyramidal signs, which did not meet the criteria for full parkinsonism.
The parkinsonian cohort was further divided according to the Hoehn-Yahr Scale12 and the Unified Parkinson’s Disease Rating Scale (UPDRS; common UPDRS score and motor activity UPDRS Part III)13 into early PD group (30 patients with early uncomplicated PD, 22 of whom were treatment-naïve at the time of neurophysiological study) and advanced PD group (19 patients). Table 1 summarizes in detail the demographic and clinical features of the study population.
Clinical methods. All participants underwent detailed history and general and neurological examination. PD stage and severity were classified using the Hoehn-Yahr Scale12 and the common UPDRS score and motor activity UPDRS Part III (Table 2).13 Global functional impairment by PD was assessed by the Schwab and England Activities of Daily Living Scale.14 Cognitive assessment was accomplished using the Mini-mental Status Examination scale.
Neurophysiological method (CNV). All studies were performed between 08:00 and 11:00 a.m. The participants had eaten breakfast; those on treatment had taken the morning dose of antiparkinsonian medication. None had used alcohol and/or psychoactive medications during the previous 24 hours. The patients were comfortably seated in a sound- and light-proof room in a quiet wakefulness with eyes closed and the event button mounted on the right armrest. An optimal intensity of the “flash” stimulus was used (17%) so as not to cause blink artifacts.
The CNV was recorded using modified method described by Walter et al4 on a two-channel electromyography/evoked potentials (EMG/EP) machine (NeuroMER, Neurosoft; Athens, Greece). Scalp electrodes (Ag/AgCl discs) were placed after the 10 to 20 system, recording from Fz and Cz with a common bimastoid reference and a ground electrode on Fpz. Impedance was kept below 3kΩ. Filter setting was 0.02Hz to 10Hz. Forty pairs of incentives were delivered at random intervals. First, cueing (Sw; S1) signal was a sound stimulus (frequency 1000Hz; intensity 60dB above the hearing threshold [HL]; duration of 200msec) applied through audiometric headphones (TDH 49-10Ω).The second “imperative” (Si; S2) stimulus was a single “flash” with duration 50msec, generated by a LED source photo stimulator. Interstimulus intervals (ISIs) in every individual test were slightly modified at random intervals by 10 percent (software generated) to avoid habituation. Between tests, ISI was changed manually, and two intervals (1700 and 2000msec respectively) were used. Responses were automatically canceled and eliminated from averaging if the response fell outside of the 500msecs time window (250msec before to 250msec after the Si). The number of dropouts was calculated as the percent of wrong answers. Mean electroencephalography (EEG) value within one second preceding the first stimulus was taken as a baseline. Time markers for Sw (S1), Si (S2), and the moment of button pressing (PressB) were automatically placed on the averaged curves (Figure 1). Early “perceptual” components, N1 and P2, were distinct, persistent, and marked manually. The following components N2 and P3 were not consistent and sometimes absent. Therefore, they were not subject to examination and analysis. After the Si, the well-defined positive wave of the referent potential (RAP) and the postimperative negative wave (PINW) were observed. RAP was only seen when an external motor response was required. In tasks involving ignoring (where no motor response is required), a poststimulus potential resembling P3 was observed instead of RAR. Reaction time (RT) was automatically calculated after Sw (S1). The mean deviation in reaction time (RMS) was also estimated with a graphical representation of the variance in milliseconds. The error rate (responses beyond the specified range of 250 msec before to 250 msec after the Si) was also calculated.
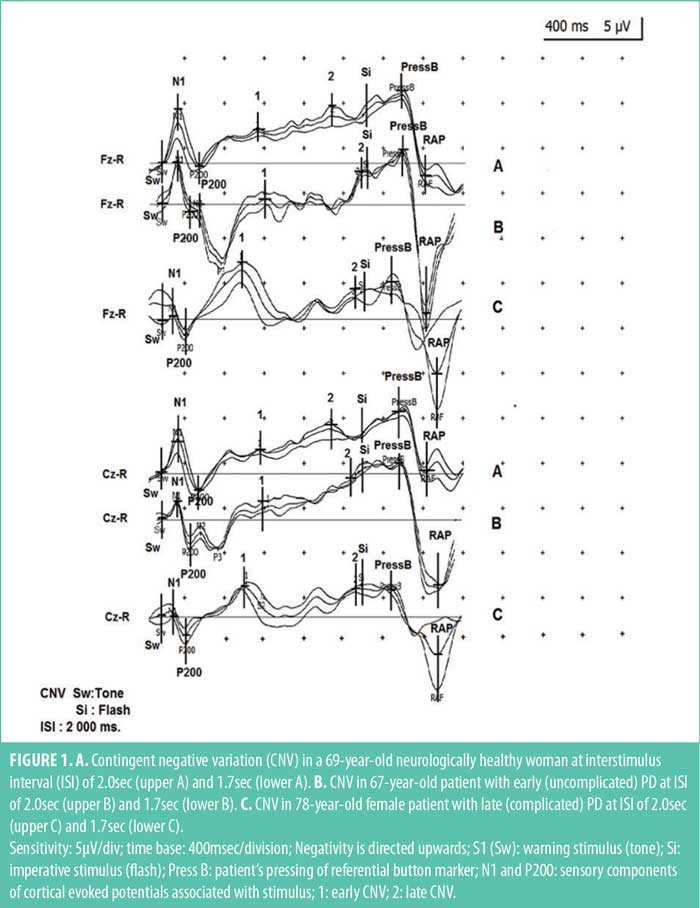
The early and late CNV components were then defined and assessed. The first component (early CNV) identification was easy, as it appeared as a distinct peak right after the last sensory components, N2 and P3. The second component (late CNV) identification was generally more difficult, as it presented not as a peak, but rather a negative slope, the onset of which featured considerable variability and was highly dependent on ISI changes. The peak of late CNV could precede the time of imperative stimulus, coincide with it, and, most often culminate immediately after it; the end of the late CNV was well demarcated by the clearly defined positive deflection of RAR (Figure 1). In our study, the amplitude of CNV at the time point 100msec before Si (S2) was measured. The late CNV latency was defined as the latency of the maximum negativity preceding Si (S2). In the short interstimulus paradigm, ISI was 1,700msec, and the amplitude of CNV at 1,250msec after S1 (Sw) stimulus was additionally registered. In the long interstimulus paradigm, ISI was 2,000msec at 1,200msec and 1,600msec after S1 (Sw). This was aimed at more detailed tracing of the development of this negativity in time. Our numerous observations showed that if the subjects first performed tests with the short paradigm followed by the long paradigm tests, an early peak and rapid decline in the negativity before Si was observed. This phenomenon is more common in patients with PD. To avoid this development of subjective standard time, we alternated averaging of series of responses with long paradigm with recordings with short paradigm. Two tests were made with each ISI (1.7 and 2.0sec), after which the curves at one and the same ISI were repeatedly averaged. During each test, between recordings with long- and short-paradigm, to maintain active attention, the patients performed several ignoring-paradigm responses, not included in analysis. RT, erroneous answers percentage (outside: 250msec+250msec range), and time dispersion of responses in milliseconds were recorded automatically. Besides early and late CNV amplitudes, those of RAR were recorded in our study, though it was not an inherent part of the preparation process.
Comparative analysis of the group influence, as well as of UPDRS, UPDRS Part III, Hoen-Yahr Scale, and Schwab and England Activities of Daily Living Scale values on the latency and amplitude of the early and late CNV for each Fz and Cz lead in particular, and for the short and long paradigms, were conducted.
Statistical method. The survey data were processed with statistical software packages STATISTICA, Vers.10.0, STATGRAPHICS; SPSS and EXCEL for Windows. The results were described using tables, plots, and numerical indicators of structure, frequency, mean values, and correlation coefficients. Results with normal and near-normal distribution of cases were analyzed using the following parametric tests: t-test, ANOVA with post-hoc tests Tukey, Scheffe, Bonferroni, Newman-Keuls, and Duncan. In other than normal distribution of cases, we applied nonparametric tests (Pearson’s Χ², Mann-Whitney U, Kruscal-Wallis H-test). Regression models were used for modeling and forecasting of correlation dependances. The significance of the results, findings, and conclusions were determined at p<0.05.
Results
The mean Hoehn-Yahr modified scale score of the early PD group was significantly lower, compared to the late PD group (p<0.00005). Differences in results according to UPDRS, UPDRS Part III, and Schwab and England Activities of Daily Living Scale were statistically valid between the two clinical groups (p<0.00005). The groups did not differ significantly in age distribution and cognitive capacity (Table 1). The latency of early and late CNV was not influenced by the presence of PD (controls vs. patients with PD), nor by its severity (early vs. advanced group). There was no difference in the latency of early CNV at ISI of 1.7sec versus ISI of 2.0sec. The amplitude of the early CNV response did not differ between the clinical and control groups either, both over the two leads (Fz and Cz) and using the two ISIs.
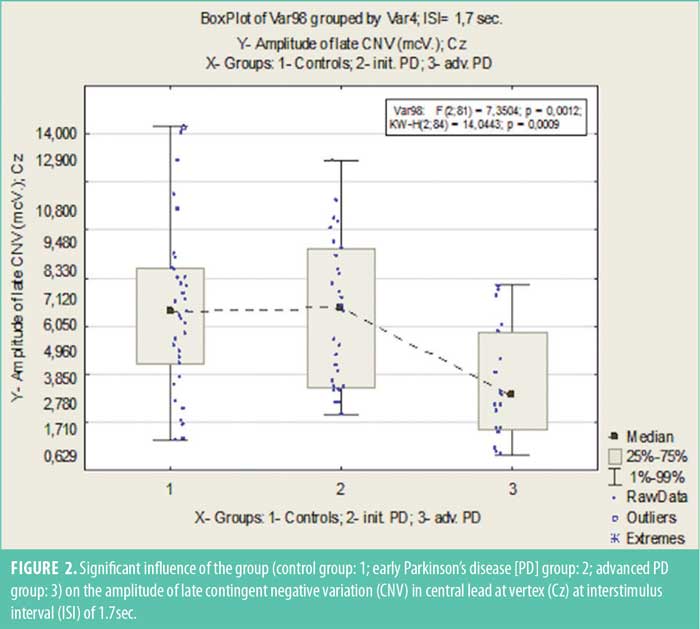
However, the amplitude of the late CNV in Cz lead in patients with advanced PD was markedly reduced (p<0.005) in tasks with the ISI of 1.7sec (Figure 2) and reduced (p<0.05) in tasks with the ISI of 2.0sec, compared to the other two groups. In pooled data, at ISI of 1.7sec, the late CNV amplitude over the central vertex correlated negatively with total URDRS score (r=–0.322; p<0.005) and in particular, with the result of URDRS Part III (r=–0,446; p<0.005) (Figure 3).
Discussion
We found a significant decrease of the amplitude of late CNV over the central vertex in tasks with an ISI of 1.7 and 2.0sec in patients with PD. The latencies of the early and late CNV were not affected by the presence and stage of PD.
Similar changes in the late CNV amplitude, mostly in the central and posterior leads, were reported by other authors.7,9,10 This specific topography of changes might be due to the fact that PD interferes with the function of neuronal complexes of the frontal and paretal lobes, which are responsible for the processing of unexpected visual-motor sensory events. This is attributed to the decrease of facilitating inputs from the respective striatal-thalamic circuits.16 This conjecture is also supported by the reported increase of CNV amplitude in the frontocentral areas after bilateral deep brain stimulation of the subtalamic nuclei in patients with PD.17
Marked reduction of the amplitude of late CNV in patients with advanced forms of PD is consistent with the results of most CNV studies that used tasks with two stimulus paradigm.9,10,18 The reduction of early RT in patients with PD reported by Dick et al20 may be interpreted in the same way, as the amplitude of the late CNV is considered to reflect the amount of early-RT and prestimulus negativity (stimulus preceding negativity).
Some authors have reported a reduction of early RT after DOPA medication, with a return to normal values upon repeated administration.20 The DOPA-induced changes of late CNV amplitude might even be dose-dependent. Our results would also support the generally held hypothesis that dopaminergic brain activity is decisive for the generation of late CNV cortical potential.21
Unlike Oishi et al,22 we did not find significant changes in the amplitude of early CNV. This might be due in part to the homogeneity of our clinical group, including only patients with degenerative parkinsonism and without cognitive deficit. In contrast, Oishi et al included a high proportion of patients with vascular parkisonianism, who also had more severe cognitive changes.22 However, early CNV changes are nonspecific for PD; the amplitude of the early CNV increases after intravenous L-DOPA, both in patients with degenerative parkinsonism and in those with vascular forms of the disease.
An increase of postimperative negative variation was found in PD and suggested as a side effect of the antipsychotic medication.23 A disadvantage of this study is that we did not investigate the influence of L-DOPA administration and withdrawal on CNV parameters. This was not done because we did not have the ethical approval to manipulate patients’ treatment regimens. Furthermore, 20 patients in the group with early PD were newly diagnosed patients who were treatment-naïve.
The relatively small number of patients prevents us from drawing definite conclusions on the possible diagnostic role of CNV in early PD. The abnormalities in our cohort with early PD were minimal, with CNV amplitude values close to those of healthy controls. Hence, our findings contrast other studies suggesting that CNV changes might provide an early neurophysiological marker of dopamine deficiency.24
Conclusion
In conclusion, in patients with PD, we found changes of the late CNV, which reflects the clinical progression of the disease. Further pharmacological and neurophysiological studies are needed to define the role of these changes in the diagnosis and staging of PD.
References
- European Medicines Agency. COVID-19 vaccine AstraZeneca: PRAC preliminary view suggests no specific issue with batch used in Austria. 3 Oct 2021. https://www.ema.europa.eu/en/news/COVID-19-vaccine-astrazeneca-prac-preliminary-view-suggests-no-specific-issue-batch-used-austria. Accessed 26 Nov 2021.
- Kantarcioglu B, Iqbal O, Walenga JM, et al. An update on the pathogenesis of COVID-19 and the reportedly rare thrombotic events following vaccination. Clin Appl Thromb Hemost. 2021;27:10760296211021498.
- Hernández AF, Calina D, Poulas K, et al. Safety of COVID-19 vaccines administered in the EU: should we be concerned? Toxicol Rep. 2021;8:871–879.
- Goss AL, Samudralwar RD, Das RR, Nath A. ANA investigates: neurological complications of COVID-19 vaccines. Ann Neurol. 2021;89(5):856–857.
- McGonagle D, De Marco G, Bridgewood C. Mechanisms of immunothrombosis in vaccine-induced thrombotic thrombocytopenia (VITT) compared to natural SARS-CoV-2 infection. J Autoimmun. 2021;121:102662.
- Mehta PR, Apap Mangion S, Benger M, et al. Cerebral venous sinus thrombosis and thrombocytopenia after COVID-19 vaccination–a report of two UK cases. Brain Behav Immun. 2021;95:514–547.
- Blauenfeldt RA, Kristensen SR, Ernstsen SL, et al. Thrombocytopenia with acute ischemic stroke and bleeding in a patient newly vaccinated with an adenoviral vector-based COVID-19 vaccine. J Thromb Haemost. 2021;19(7):1771–1775.
- Al-Mayhani T, Saber S, Stubbs MJ, et al. Ischaemic stroke as a presenting feature of ChAdOx1 nCoV-19 vaccine-induced immune thrombotic thrombocytopenia. J Neurol Neurosurg Psychiatry. 2021;92(11):1247–1248.
- Kow CS, Hasan SS. Cerebral venous thrombosis following COVID-19 vaccination. J Stroke Cerebrovasc Dis. 2021;30(10):105866.
- Greinacher A, Thiele T, Warkentin TE, et al. Thrombotic thrombocytopenia after ChAdOx1 nCov-19 vaccination. N Engl J Med. 2021;384(22):2092–2101.
- Hughes C, Nichols T, Pike M, et al. Cerebral venous sinus thrombosis as a presentation of COVID-19. Eur J Case Rep Intern Med. 2020;7(5):001691.
- Ciccone A. SARS-CoV-2 vaccine-induced cerebral venous thrombosis. Eur J Intern Med. 2021;89:19–21.
- Ceresetto J. Trombosis y vacuna para COVID-19. What can we hematologists say? Rev Hematol. 2021;25(1):72–75.
- Toor J, Echeverria-Londono S, Li X, et al. Lives saved with vaccination for 10 pathogens across 112 countries in a pre-COVID-19 world. eLife. 2021;10:e67635.
- Ritchie H, Mathieu E, Rodés-Guirao L, et al. Coronavirus pandemic (COVID-19). 2020. https://ourworldindata.org/covid-vaccinations. Accessed 26 Nov 2021.
- Shoukat A, Vilches TN, Moghadas SM, et al. Lives saved and hospitalizations averted by COVID-19 vaccination in New York City: a modeling study. Lancet Reg Health Am. 2022;5:100085.