
 by Joanna P. MacEwan, PhD; Seth Seabury, PhD; Myrlene Sanon Aigbogun, MPH; Siddhesh Kamat, MS, MBA; Emma van Eijndhoven, MS, MA; Clement Francois, PhD; Crystal Henderson, PharmD, BCPP; and Leslie Citrome, MD, MPH
Dr. MacEwan and Ms. van Eijndhoven are with Precision Health Economics in Los Angeles, California, USA; Dr. Seabury is with the University of Southern California, Los Angeles, California, USA; Ms. Aigbogun, Mr. Kamat, and Dr. Henderson are with Otsuka America Pharmaceutical, Inc. in Princeton, New Jersey, USA; Dr. Francois is with Lundbeck LLC in Deerfield, Illinois, USA; and Dr. Citrome is with the New York Medical College, Valhalla, New York, USA.
Innov Clin Neurosci. 2016;13(7–8):17–25
Funding: This study was funded by Otsuka America Pharmaceutical, Inc., Princeton, New Jersey, USA; Otsuka Pharmaceutical Development and Commercialization, Inc., Princeton, New Jersey, USA; and Lundbeck LLC, Copenhagen, Denmark. Editorial support for the preparation of this manuscript was funded by Otsuka America Pharmaceutical, Inc. and Lundbeck LLC.
Financial disclosures: Dr. MacEwan and Ms. van Eijndhoven are employees of Precision Health Economics, a healthcare consulting firm that has received consultancy fees from Otsuka America Pharmaceutical, Inc.; Dr. Seabury is a consultant for and has received personal fees from Precision Health Economics; Ms. Aigbogun, Mr. Kamat, and Dr. Henderson are employees of Otsuka America Pharmaceutical, Inc.; Dr. Francois is an employee of Lundbeck LLC; and in the past 36 months, Dr. Citrome has engaged in collaborative research with or received consulting or speaking fees from the following: Allergan (Actavis, Forest), Alexza, Alkermes, AstraZeneca, Avanir, Bristol-Myers Squibb, Eli Lilly, Forum, Genentech, Janssen, Jazz, Lundbeck, Medivation, Merck, Mylan, Novartis, Noven, Otsuka, Pfizer, Reckitt Benckiser, Reviva, Shire, Sunovion, Takeda, Teva, and Valeant and owns a small number of shares of common stock in Bristol-Myers Squibb, Eli Lilly, Johnson & Johnson, Merck, and Pfizer.
Key words: Mental disorders, schizophrenia, bipolar disorder, major depressive disorder, pharmaceutical innovation, disease burden, research and development, expenditures
Abstract: Objectives: The objectives of this study were to assess the level of private and public investment in research and development of treatments for schizophrenia and other mental disorders compared to other diseases in order to present data on the economic burden and pharmaceutical innovation by disease area, and to compare the level of investment relative to burden across different diseases.
Design: The levels of investment and pharmaceutical innovation relative to burden across different diseases were assessed. Disease burden and prevalence for mental disorders (schizophrenia, bipolar disorder, and major depressive disorder); cancer; rheumatoid arthritis; chronic obstructive pulmonary disorder; diabetes; cardiovascular disease; and neurological disorders (dementia and epilepsy) were estimated from literature sources.
Setting: Pharmaceutical treatment innovation was measured by the total number of drug launches and the number of drugs launched categorized by innovativeness. Research and development expenditures were estimated using published information on annual public and domestic private research and development expenditures by disease area. Lastly, investment relative to disease burden was measured among the set of disease classes for which all three measures were available: schizophrenia, bipolar disorder, major depressive disorder, cancer, rheumatoid arthritis, chronic obstructive pulmonary disease, diabetes, cardiovascular disease, and neurology (dementia and epilepsy combined).
Results: The level of investment and pharmaceutical innovation in mental disorders was comparatively low, especially relative to the burden of disease. For mental disorders, investment was $3.1 per $1,000 burden invested in research and development for schizophrenia, $1.8 for major depressive disorder, and $0.4 for bipolar disorder relative to cancer ($75.5), chronic obstructive pulmonary disease ($9.4), diabetes ($7.6), cardiovascular disease ($6.3), or rheumatoid arthritis ($5.3). Pharmaceutical innovation was also low for mental disorders.
Conclusion: Despite the significant burden mental disorders impose on society, investment and pharmaceutical innovation in this disease area remains comparatively low. Policymakers should consider new strategies to stimulate public and private investment in the research and development of novel and effective therapies to treat schizophrenia and other mental disorders.
Introduction
Over the last two decades, there have been remarkable breakthroughs in healthcare. These breakthroughs include the development of novel pharmaceutical treatments that have significantly improved outcomes for patients suffering from various medical conditions. For example, the development of a highly effective antiretroviral therapy has dramatically increased survival among patients with human immunodeficiency virus/acquired immune deficiency syndrome (HIV/AIDS), changing the disorder from a fatal illness with a very poor prognosis to a chronic and manageable condition.[1] Similarly, the development of cholesterol-lowering medications has led to population-wide reductions in mortality from cardiovascular disease, and tyrosine-kinase inhibitors have changed the landscape for the treatment of chronic myeloid leukemia.[2,3] However, despite these successes, there are many serious chronic conditions where the pace of pharmaceutical innovation has been considerably slower. The relationship between pharmaceutical investment in research and development (R&D), treatment innovation, and the burden of disease is largely unknown.
One area where the pace of innovation appears to have been particularly slow is in the development of treatments for schizophrenia and other mental disorders. The pharmacological standard of care of schizophrenia since the mid-1950s has been the use of antipsychotic medications. These medications have evolved with the development of first-line second-generation antipsychotics (atypical antipsychotics) introduced in the 1990s, but have otherwise remained mostly unchanged. This is at least partly due to the lack of new breakthrough therapies to treat mental disorders, a term used here to represent schizophrenia, bipolar disorder (BPD), and major depressive disorder (MDD). There are many basic challenges to companies seeking to develop new therapies to treat mental disorders that could explain a comparative lack of innovation, including the complexity of the human brain and the relative inadequacy of animal models, as well as budgetary constraints faced by state Medicaid programs, one of the dominant payers for patients with mental disorders.[4–7]
While there may be reasons for the relative lack of innovation in treatments for mental disorders, it is of great potential concern because there is significant need for mental health care in the United States.[8–10] All else equal, diseases from which more patients suffer or that impose a greater burden should receive more investment in research, because the social returns from alleviating the burden would be greatest. However, in the case of public spending, others have noted wide disparities in the relationship between investments in R&D and disease burden. Moses et al[11] compared the allocation of Federal research dollars across 27 disease states and found significant differences in National Institutes of Health (NIH) disease-specific research funding for diseases with similar disability-adjusted life years (DALY). For instance, schizophrenia and sexually transmitted diseases (excluding HIV) receive similar amounts of NIH research funding, $286 million and $275 million (US$), respectively, despite schizophrenia causing a significantly higher number of DALYs (835 vs. 50 for sexual transmitted diseases). Schizophrenia also has a significantly higher number of DALYs than dental and oral disease (565), but receives approximately half the NIH funding compared to dental and oral disease ($516 million). However, it is unclear whether private investment in the development of new pharmaceutical treatments follows the same path as public investment, and how this investment varies across diseases.
This study compares the level of private and public investments to develop new treatment options for schizophrenia and other mental disorders to that of other diseases. We also compare economic burden, pharmaceutical innovation, and the ratio of investment to burden across the different disease states. This analysis helps assess whether investments in R&D for the treatment of mental disorders are proportional to the cost of the diseases and identifies areas that may need additional efforts to promote new innovations.
Methods
To assess the level of investment and pharmaceutical innovation relative to burden across different diseases, data were combined from multiple sources on 1) estimates of disease burden and prevalence, 2) pharmaceutical treatment innovation (as measured by the total number of drug launches and the number of drugs launched categorized by innovativeness), and 3) R&D expenditures (public and private).
Disease burden and prevalence. To benchmark investment in mental disorders compared to other diseases, diseases were selected for which burden estimates were available and for which reliable disease-specific rates of R&D expenditures could be constructed.
All measures were collected separately for the following disease states: schizophrenia, BPD, MDD, cancer, rheumatoid arthritis (RA), chronic obstructive pulmonary disorder (COPD), diabetes, cardiovascular disease (CVD), and neurological disorders (dementia and epilepsy). Targeted searches in PubMed and Google Scholar were conducted to collect estimates for burden and prevalence by disease. Annual direct and indirect cost estimates were used to measure disease burden. To the extent possible, data were gathered based on comparable populations and in comparable time frames. The dollar values were inflated from their source year to 2014 dollars using the United States Bureau of Labor Statistics Consumer Price Index for all urban consumers.[12] It is common for disease burden estimates to approximate incremental medical costs that include both the direct costs associated with the disease as well as any comorbidities that are commonly associated with the disease (e.g., part of the burden of diabetes are the cardiovascular sequelae). Thus the burden estimates per disease class are not necessarily restricted to within that disease class, as in many cases the costs of certain diseases include the cost of the disease’s comorbidities. This may lead to double counting when summing the cost of different diseases based on these burden estimates.
Pharmaceutical innovation. For pharmaceutical innovation, two measures of innovation were used: 1) the number of total drug launches between 1987 and 2014, and 2) the number of drug launches between 1987 and 2014 categorized according to their innovativeness. Both measures used the drug launches/approvals drawn from previous research conducted by Lanthier et al.[13] For 2012–2014, this list was updated using the United States Food and Drug Administration (FDA) Annual New Drugs Summary reports.[14–16] Drugs were categorized according to their innovativeness using the classification system provided by Lanthier et al.[13] The categories were as follows: 1) first-in-class, 2) advance-in-class, and 3) addition-to-class. First-in-class drugs are drugs that are the first treatment for a certain disease area, advance-in-class drugs are drugs that have substantial advantages over current drugs in a particular class, and addition-to-class are drug launches that are neither first-in-class nor advance-in-class drugs. The assignment of drugs to one of these categories is based on drug class, date of approval, and whether the drug was under priority review (priority review to determine advance-in-class or addition-to-class).[13] To separate the new products into different disease states, the new drugs were linked to the Medi-Span® data, a proprietary drug database that includes information on therapeutic areas and diseases[17] Using this information, each drug in the list of drug launches was aggregated and the cumulative number of drug launches within a disease area was counted, with some medications having multiple indications.
R&D expenditures. R&D expenditures were estimated using published information on annual public and domestic private R&D expenditures by disease area from the Pharmaceutical Research and Manufacturers of America (PhRMA) 2014 biopharmaceutical research industry profile report (reporting all expenditures for 2014, regardless of approval), various disease area specific PhRMA Medicines in Development reports, and the NIH almanac as measures of investment in innovation.[18–27] PhRMA represents leading innovative biopharmaceutical research and discovery companies in the United States and conducts effective advocacy for public policies that encourage discovery of new medicines by pharmaceutical and biotechnical research companies. PhRMA produces reports and white papers on the biopharmaceutical industry as well as fact sheets on the latest innovation and biopharmaceutical industry updates.
Investment/burden analysis. Investment relative to disease burden was measured among the set of disease classes for which all three measures were available: schizophrenia, BPD, MDD, cancer, RA, COPD, diabetes, CVD, and neurology (dementia and epilepsy combined). Measures of innovation are cumulative while those of investment and burden are annual estimates based on the most recent data available. Both investment and economic burden estimates by disease were collected in order to be able to report investment per $1,000 of economic burden (2014 US$). Pharmaceutical innovation as an extension of investment was also compared to disease burden.
Results
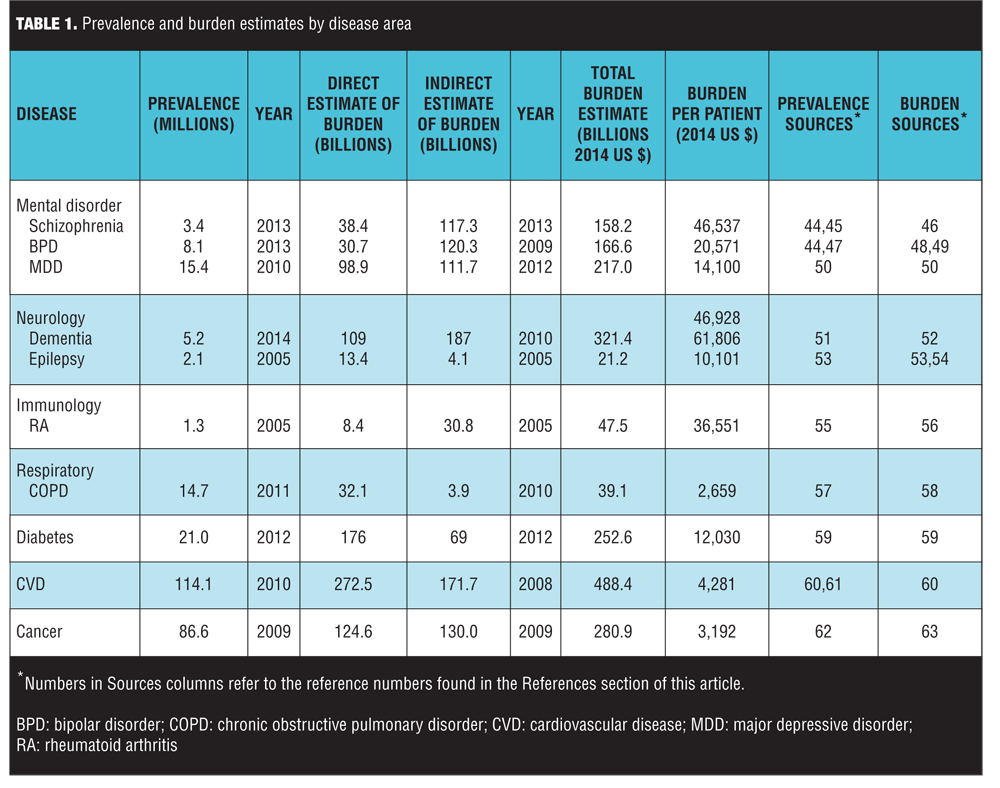
The disease burden estimates and prevalence counts are summarized in Table 1.[44–63] The three diseases with the highest societal disease burden in 2014 were CVD ($488.4 billion), dementia ($321.4 billion) and cancer ($280.9 billion) (all estimates in 2014 US$). The total burden estimates were driven in part by disease prevalence. On a per-patient basis, the three diseases with the highest disease burden were dementia ($61,806 per patient), RA ($36,551), and schizophrenia ($46,537). Both schizophrenia and BPD had a considerably higher estimated indirect than direct disease burden (Columns 4 and 5 of Table 1), reflecting the relatively early age of onset and comparatively high impact of mental disorders on productivity. It is noteworthy that while the per-patient burden of cancer was relatively low, this is primarily because the burden estimates did not incorporate the value of the life-years lost associated with terminal illness.
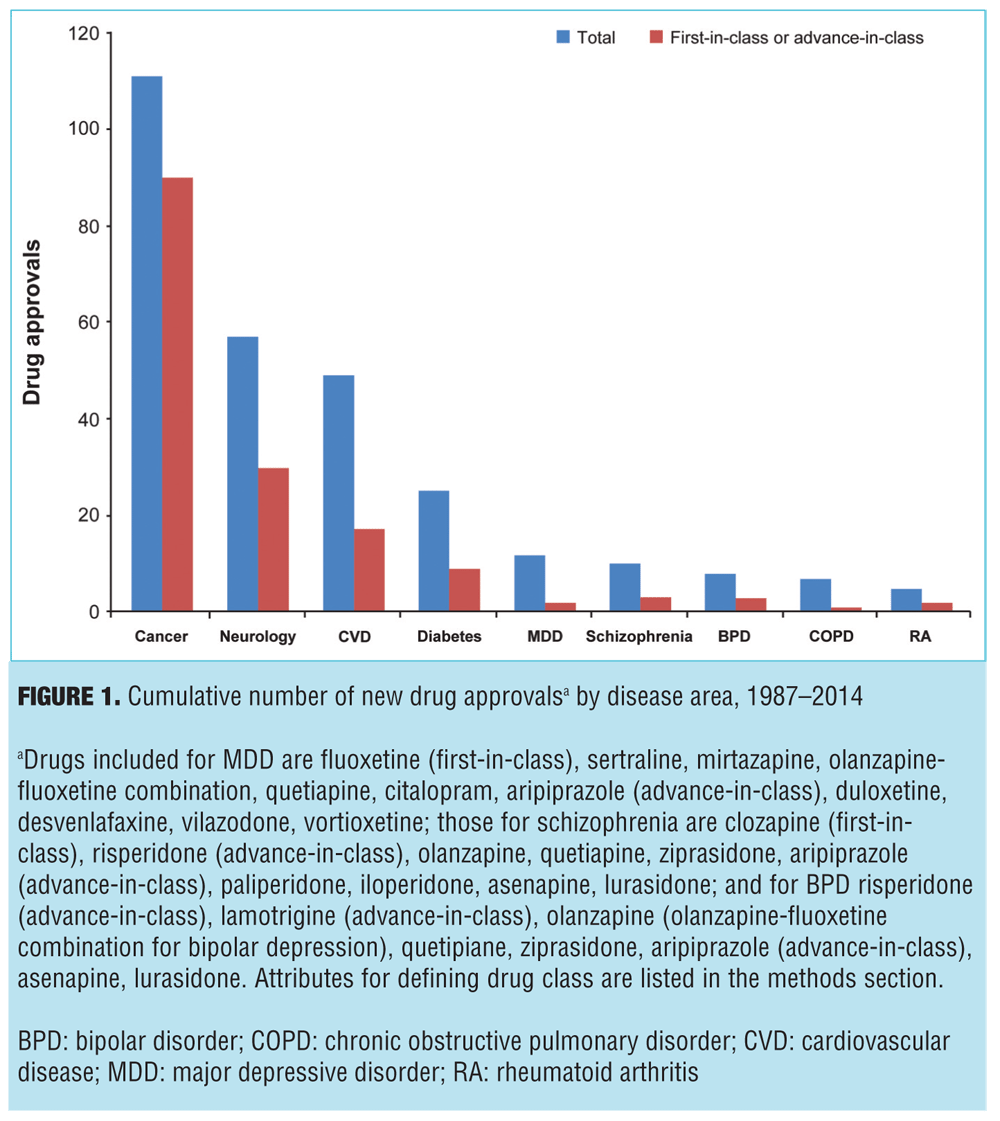
Pharmaceutical innovation is presented in Figure 1, which displays the number of FDA approved drugs between 1987 and 2014, both in total and for first-in-class or advance-in-class drugs. Of the nine disease areas, the most new drugs were approved for cancer (111 total new drugs), while schizophrenia had 10 new drug approvals. In addition to having the most new drugs, cancer also had the most drugs that were first- or advance-in-class at 90 (81% of all new approvals), while schizophrenia had one first-in-class (clozapine in 1989) and two advance-in-class (risperidone in 1993—the first first-line, second-generation antipsychotic—and aripiprazole in 2002—the first dopamine partial agonist) making up just 30 percent of new schizophrenia drugs. Of note, the assessment did not consider new formulations of approved drugs, which would include risperidone long-acting injectable (the first second-generation antipsychotic available as a long-acting injectable), ziprasidone short-acting injectable (the first second-generation antipsychotic available as a short-acting injectable and approved for the treatment of agitation associated with schizophrenia), and inhaled loxapine (the first inhaled antipsychotic approved for agitation associated with schizophrenia or bipolar mania). Nor does it reflect the three-month formulation of paliperidone palmitate (the first 3-month, long-acting antipsychotic formulation) or olanzapine-fluoxetine combination (the first agent approved for bipolar depression). Additionally, this assessment did not evaluate all drugs in development as it did not include failed drugs, the implications of which are discussed further.
Private R&D expenditures in pharmaceutical products and federal appropriations for biomedical research by disease area are presented in Table 2. Note that because of differences in the data, the disease areas were not perfectly aligned. Also, the federal appropriations included both research and other spending, whereas the private R&D estimates were solely for pharmaceutical products. Despite this, there were some noteworthy differences between public and private investment. The most striking difference was the large disparity between public and private investment in cancer research. While cancer accounted for the largest share of both public and private research, the private investments were highly skewed; 72.6 percent (=$20.87/28.73) of private R&D expenditures were devoted to cancer compared to 25 percent of public appropriations (Table 2). It is not surprising that cancer accounted for the highest portion of private investment, as these results parallel the results observed for pharmaceutical innovation.
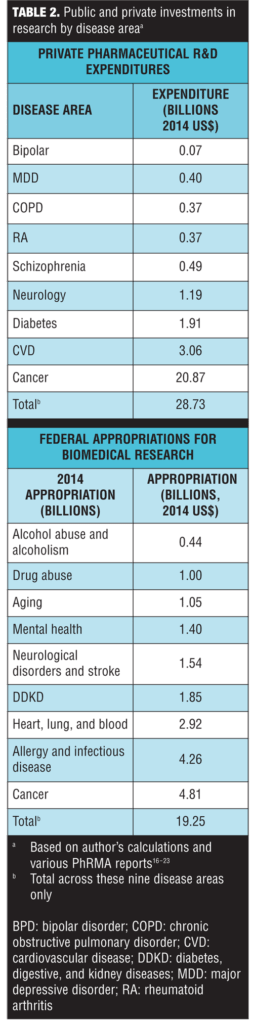
In terms of mental health, schizophrenia accounted for 1.7 percent of private research investment and mental disorders overall accounted for a total of 3.3 percent. Mental health accounted for 7.3 percent of Federal appropriations, while mental health combined with substance abuse and drug addiction (both highly comorbid with mental disorders) combined accounted for 14.7 percent.[28 ]However, if cancer spending was excluded, the disparity was less pronounced. As a percent of non-cancer, private R&D expenditures, schizophrenia accounted for 6.2 percent and mental disorders accounted for a total of 12.2 percent. In comparison, mental health accounted for 9.7 percent of non-cancer Federal appropriations.
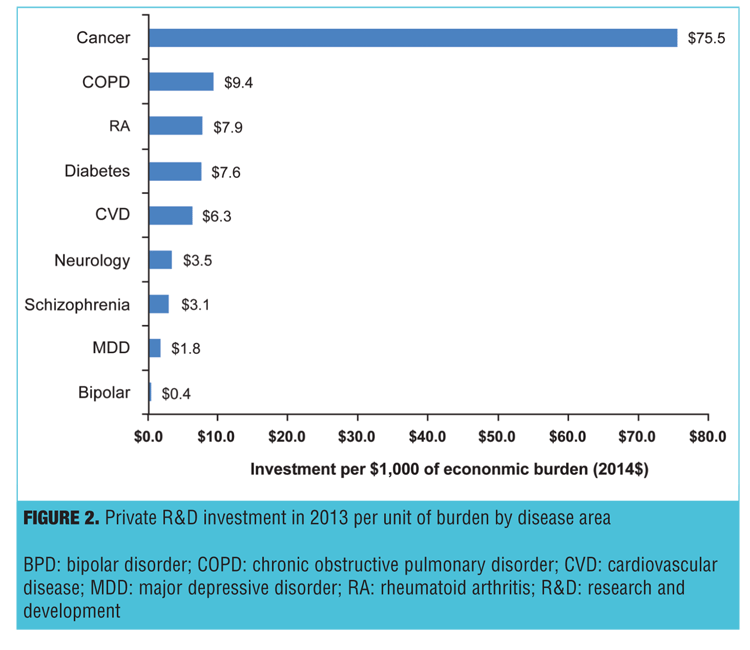
Figure 2 presents the total investment in private R&D expenditures for pharmaceuticals per $1,000 of disease burden. Compared with cancer, neurology, RA, COPD, and mental disorders (schizophrenia, MDD, and BPD) received less investment per $1,000 disease burden. There was $3.1 per $1,000 burden invested in R&D for schizophrenia, $1.8 for MDD and $0.4 for BPD. The relative investment in schizophrenia and other mental disorders is low compared to cancer ($75.5), COPD ($9.4), diabetes ($7.6), CVD ($6.3) or RA ($5.3). Although all diseases were low compared to cancer ($75.5), mental disorders were also low compared to other diseases.
The results observed with private investment (Table 2) parallel those observed with pharmaceutical innovation (Figure 1), and pharmaceutical innovation is not possible without investment. Therefore, a comparison of pharmaceutical innovation and disease burden can also be made. It follows from the above results that the relative pharmaceutical innovation in schizophrenia, MDD, and BPD relative to disease burden is also low compared to the other diseases listed.
 Discussion
 Discussion
The rates of pharmaceutical innovation as measured by new drug approvals and pharmaceutical R&D expenditures relative to disease burden for schizophrenia, BPD, and MDD were compared to those in six other disease states. In general, the level of investment and pharmaceutical innovation in mental disorders was relatively low, especially compared with the burden of disease. By far, the biggest share of private investment, both overall and per unit of disease burden, was dedicated to cancer, which is expected due to the high societal value on reducing mortality risk. But even excluding cancer from the assessment, we found that the lowest levels of investment per dollar of disease burden across all diseases were dedicated to mental disorders. While we did find that the relative innovation did appear higher in mental disorders when we examined the total number of drugs that have gone through Phase 2 and Phase 3 clinical trials, many of these treatments (e.g., pomaglumetad, dihydrexine, bitopertin, MP-10, TC-5619) never make it out of clinical trials and into commercial use.[32]
The relatively low private investment in mental disorders is perhaps understandable given the many challenges of developing treatments for mental disorders and central nervous system (CNS) disorders in general. The estimated success rate or percentage of the drugs that enter into clinical trials that receive market approval is 6.2 percent for CNS drugs, less than half the average success rate of non-CNS drugs (13.1%).5 In addition, it takes an average of 8.8 years for a CNS drug to go through development and approval, compared to 7.7 years for anti-infective, 6.9 years for CVD drugs, and 5.8 years for AIDS antivirals.[29] There are many reasons for the lower success rate and higher drug development time of CNS drugs, including scientific challenges of lack of effective animal models, insufficient biomarkers to guide treatment decisions, and designs and psychiatric rating systems of clinical trials,[30–33] as well as comparatively high side-effect risk and significant heterogeneity in treatment response.[34–37]
Drug development for mental disorders may face additional challenges beyond these scientific issues that could further discourage investment. Patients with mental disorders are disproportionately more likely to receive their healthcare coverage from Medicaid.[38] However, the financial challenges facing state Medicaid programs have pushed the implementation of restrictive formulary practices to deter the use of newer brand products and promote the use of less expensive generic alternatives.[39] In the wake of the recent financial crisis, Medicaid reimbursements for mental disorder drug treatments also decreased.[6,7] In addition to potentially worsening outcomes for Medicaid beneficiaries,[39,40] reducing utilization of and limiting reimbursements for newer, more innovative treatments could further reduce the incentive to develop innovative treatments for mental disorders.
These reported findings raise important questions about whether sufficient public and private investments are being made in developing treatments for schizophrenia and other mental disorders. The per-patient costs of mental disorders are extremely high. Failure to properly treat and control these diseases can impose significant external costs on families and caregivers. Additionally, the association with an increased likelihood of engaging in criminal and possible violent behavior further increases external costs associated with mental disorders.[41] Despite the need for improved treatment outcomes, the investment and pharmaceutical innovation trend for mental disorders appears to be meager, with fewer companies investing in drug development for mental health.[42] The findings here suggest the need to consider additional efforts to stimulate public and private R&D investment in mental disorder treatment that may lead to innovation to develop different, safe, and effective treatments for patients with mental disorders.
If the current level of investment is insufficient to meet the demand for new treatment options for patients with mental disorders, some additional steps may be needed to spur further efforts. Some suggestions for additional efforts to increase new treatment investment for mental disorders have been put forth in the response to the policy initiate on the 21st Century Cures Act from the National Alliance on Mental Illness (NAMI).[43] NAMI supported efforts to move beyond current palliative treatments and translate basic research findings on brain function for treatments for mental disorders, as well as supported the current Brain Research through Advancing Innovative Neurotechnologies Initiative and small trials focused on proof-of-concept experimental medicine paradigms.[43] More generally, policymakers should consider whether current policies and priorities provide sufficient support and incentives to invest in new treatment options for patients with mental disorders.
Limitations. Our study has several limitations. Data limitations precluded a comprehensive analysis inclusive of all disease areas. Additionally, for the disease classes for which all three measures (burden, investment, and innovation) were available, the estimates were necessarily extracted from various sources in the literature. Often these sources used different methods for measuring direct and indirect economic burden and covered different and sometimes overlapping study populations. As noted above, one important limitation of the burden estimates is the fact that they do not incorporate the value of life-years lost when the illness is terminal. This is particularly relevant for interpreting the findings with respect to cancer. Thus, while R&D expenditures are high for cancer compared to the disease burden, this does not necessarily imply that there is an “over-investing” in cancer, as the high allocation of research dollars to cancer could reflect other societal values and preferences (e.g., society might place a comparatively high value on reducing mortality risk vs. reducing disability or morbidity risk). Our study does not inform as to the optimal level of R&D investment for any given disease state, but it does highlight potential discrepancies between the level of burden and the level of investment.
Another limitation was that the measures of public and private investment (NIH appropriations) were not directly comparable as 1) NIH appropriation are for specific institutes that may cover multiple disease areas, 2) more than one institute may do research on one disease, 3) NIH appropriations include non-R&D expenditures, and 4) the NIH appropriations cover biomedical research overall, not just pharmaceutical research. Lastly, time series of private R&D expenditures or burden by disease area was not available, so the impact of time trends in investment or innovation on current burden estimates or investment decisions is unknown.
Conclusion
In conclusion, mental disorders impose a considerable burden on the United States healthcare system, patients and their families, and society at large. The development of innovative treatments for mental disorders requires significant time and financial investments in R&D. Despite the substantial burden mental disorders impose on society, investment and pharmaceutical innovation in this disease area remains comparatively low. Relative to other disease areas, mental disorders have received a disproportionately low share of R&D investment and experienced a disproportionately low share of high-impact pharmaceutical innovation. Policymakers should consider new strategies to stimulate public and private investment in R&D for novel and effective therapies to treat schizophrenia and other mental disorders.
Acknowledgment
The authors would like to acknowledge Melissa Kirk, PhD, with Scientific Connexions, Lyndhurst, New Jersey, USA (an Ashfield Company, part of UDG Healthcare plc) for her editorial support she provided to the preparation of this manuscript.
References
1. Philipson T, Jena A. Who benefits from new medical technologies? Estimates of consumer and producer surpluses for HIV/AIDS drugs. National Bureau of Economic Research. Working Paper No. 11810. December, 2005.
2. Grabowski D, Lakdawalla D, Goldman D, et al. The large social value resulting from use of statins warrants steps to improve adherence and broaden treatment. Health Aff. 2012;31(10):2276–2285.
3. Yin P, MacLean R, Lakdawalla D, Philipson T. Value of survival gains in chronic myeloid leukemia. Am J Manag Care. 2012;18(suppl 11):257–264.
4. O’Brien P, Thomas C, Hodgkin D, et al. The diminished pipeline for medications to treat mental health and substance use disorders. Psychiatr Serv. 2014;65(12):1433–1338.
5. DiMasi J. CNS drugs take longer to develop, have lower success rates, than other drugs. Tufts Center for the Study of Drug Development website. http://csdd.tufts.edu/news/complete_story/pr_ir_nov_dec_ir. November 4, 2014. Accessed June 5, 2015.
6. Medicaid.gov. Behavioral Health Services 2015 website. http://www.medicaid.gov/medicaid-chip-program-information/by-topics/benefits/mental-health-services.html. April 6, 2015. Accessed June 5, 2015.
7. State Mental Health Legislation: Trends, Themes & Effective Practices. Arlington, VA: National Alliance on Mental Health; 2014.
8. Substance Abuse and Mental Health Services Administration. Results from the 2013 National Survey on Drug Use and Health: Mental Health Findings. NSDUH Series H-49. Rockville, MD: Substance Abuse and Mental Health Services Administration. HHS Publication No. (SMA) 14-48872014.
9. Demyttenaere K, et al. Prevalence, severity, and unmet need for treatment of mental disorders in the World Health Organization World Mental Health Surveys. JAMA. 2004;291(21):2581–2590.
10. Roll JM, et al. Disparities in unmet need for mental health services in the United States, 1997–2010. Psychiatric Services. 2013;64(1):80–82.
11. Moses H, Matheson D, Cairns-Smith S, et al. The anatomy of medical research: Us and international comparisons. JAMA. 2015;313(2):174–189.
12. US Department of Labor Bureau of Labor Statistics. Consumer Price Index-All Urban Consumers. http://data.bls.gov/cgi-bin/surveymost?cu. Published 2015. Accessed February 23, 2015.
13. Lanthier M, Miller K, Nardinelli C, Woodcock J. An improved approach to measuring drug innovation finds steady rates of first-in-class pharmaceuticals, 1987-2011. Health Aff. 2013;32(8):1433–1439.
14. Center for Drug Evaluation and Research. Novel New Drugs 2013 Summary. U.S. Silver Spring, MD: Food and Drug Administration; 2014.
15. Center for Drug Evaluation and Research. Novel New Drug 2012 Summary. U.S. Silver Spring, MD: Food and Drug Administration; 2013.
16. Center for Drug Evaluation and Research. Novel New Drug 2014 Summary. U.S. Silver Spring, MD: Food and Drug Administration; 2015.
17. Medi-Span 2014. Wolters Kluwer Health website. [cited 2015 May 11]. Available from: http://www.wolterskluwerhealth.com/OurBrands/Pages/Medi-Span.aspx.
18. 2014 Biopharmaceutical Research Industry Profile. Washington, DC: PhRMA; 2014.
19. The NIH Almanac. Bethesda, MD: National Institutes of Health; 2012.
20. More Than 50 Medicines in Pipeline for Third Leading Cause of Death in the United States. Washington, DC: PhRMA; 2012.
21. Biopharmaceutical Research Companies Are Developing 180 Medicines to Treat Diabetes and Related Conditions. Washington, DC: PhRMA; 2012.
22. Ph Biopharmaceutical Research Companies Are Developing Nearly 100 Medicines for One of the Most Common Chronic Health Problems in the United States. Washington, DC: PhRMA; 2014.
23. Biopharmaceutical Companies Researching and Developing Nearly 450 Medicines for Neurological Disorders. Washington, DC: PhRMA; 2013.
24. Biopharmaceutical Research Companies Are Developing More Than 100 Medicines to Treat Mental and Addictive Disorders. Washington, DC: PhRMA; 2014.
25. The Biopharmaceutical Pipeline: Evolving Science, Hope for Patients. Washington, DC: PhRMA; 2013.
26. Biopharmaceutical Research Companies Are Developing More Than 200 Medicines for Cardiovascular Disease. Washington, DC: PhRMA; 2013.
27. Nearly 800 Medicines and Vaccines in Clincical Testing for Cancer Offer New Hope to Patients. Washington, DC: PhRMA; 2014.
28. McElroy S. Diagnosing and treating comorbid (complicated) bipolar disorder. J Clin Psychiatry. 2004;15:35–44.
29. Miller G. Is pharma running out of brainy ideas. Science. 2010;329(5991):502–504.
30. Hyman S. Revolution stalled. Sci Transl Med. 2012;4(155):155cm11.
31. Rorick-Kehn L, Johnson B, Knitowski K, et al. In vivo pharmacological characterization of the structurally novel, potent, selective mGlu2/3 receptor agonist LY404039 in animal models of psychiatric disorders. Psychopharmacology. 2007;193(1):121–136.
32. Koster L-S, Carbon M, Correll C. Emerging drugs for schizophrenia: an update. Expert Opin Emerg Drug. 2014;19(4):1–12.
33. Boksa P. A way forward for research on biomarkers for psychiatric disorders. J Psychiatry Neurosci. 2013;38(2):75–77.
34. Murrough J, Charney D. Is there anything really novel on the antidepressant horizon? Curr Psychiatry Rep. 2012;14(6):643–649.
35. Miyamoto S, Miyake N, Jarskog L, et al. Pharmacological treatment of schizophrenia: a critical review of the pharmacology and clinical effects of current and future therapeutic agents. Mol Psychiatry. 2012;17(12):1206–1227.
36. Moghaddam B, Javitt D. From revolution to evolution: the glutamate hypothesis of schizophrenia and its implication for treatment. Neuropsychopharmacology. 2012;37(1):4–15.
37. Citrome L. A review of the pharmacology, efficacy and tolerability of recently approved and upcoming oral antipsychotics: an evidence-based medicine approach. CNS Drugs. 2013;27(11):879–911.
38. Mark T, Levit K, Vandivort-Warren R, et al. Changes in US spending on mental health and substance abuse treatment, 1986-2005, and implications for policy. Health Aff. 2011;30(2):284–292.
39. Vogt W, Joyce G, Xia J, et al. Medicaid cost control measures aimed at second-generation antipsychotics led to less use of all antipsychotics. Health Aff. 2011;30(12):2346–2354.
40. Seabury S, Goldman D, Kalsekar I, et al. Formulary restrictions on atypical antipsychotics: impact on costs for patients with schizophrenia and bipolar disorder in Medicaid. Am J Manag Care. 2014;20(2):52–60.
41. Goldman D, Fastenau J, Dirani R, et al. Do Medicaid prior authorization policies lead to increased imprisonment among schizophrenia patients? Am J Manag Care. 2014;20(7):577–586.
42. Kaitin K, Milne C. A dearth of new meds: drugs to treat neuropsychiatric disorders have become too risky for Big Pharma. Scientific American. 2011 August 1.
43. NAMI Responses to the House Energy & Committee 21st Century Cures Proposal. Arlington, VA: National Alliance on Mental Illness; 2014.
44. United States Census Bureau. Current Population Survey (CPS): HI01. Health Insurance Coverage Status and Type of Coverage by Selected Characteristics. http://www.census.gov/hhes/www/cpstables/032014/health/h01_000.htm. Published 2013. Accessed February 10, 2015.
45. National Institute of Mental Health. Schizophrenia 2015. http://www.nimh.nih.gov/health/statistics/prevalence/schizophrenia.shtml. Published 2015. Accessed February 10, 2015.
46. The Economic Burden of Schizophrenia in the Unites States. Tokyo, Japan: Otsuka; 2015.
47. National Institute of Mental Health. Bipolar disorder among adults. http://www.nimh.nih.gov/health/statistics/prevalence/bipolar-disorder-among-adults.shtml. Published 2015. Accessed May 13, 2015.
48. Dilsaver S. An estimate of the minimum economic burden of bipolar I and II disorders in the United States: 2009. J Affect Disord. 2011;129(1-3):79–83.
49. Wyatt R, Henter I. An economic evaluation of manic-depressive illness–1991. Soc Psychiatry Psychiatr Epidemiol. 1995;30(5):213–219.
50. Greenberg P, Fournier A, Sisitsky T, et al. The economic burden of adults with major depressive disorder in the United States (2005 and 2010). J Clin Psychiatry. 2015;76(2):155–162.
51. Alzheimers Association. 2014 Alzheimer’s Disease Facts and Figures. https://www.alz.org/downloads/Facts_Figures_2014.pdf. Published 2015. Accessed September 16, 2015.
52. Hurd M, Martorell P, Delavande A, et al. Monetary costs of dementia in the United States. NEJM. 2013;368(14):1326–1334.
53. Hirtz D, Thurman D, Gwinn-Hardy K, et al. How common are the “common” neurologic disorders? Neurology. 2007;68(5):326–337.
54. Ivanova J, Birnbaum H, Kidolezi Y, et al. Economic burden of epilepsy among the privately insured in the US. Pharmacoeconomics. 2010;28(8):675–685.
55. Helmick C, Felson D, Lawrence R, et al. Estimates of the prevalence of arthritis and other rheumatic conditions in the United States. Part I. Arthritis Rheum. 2008;58(1):15–25.
56. Birnbaum H, Pike C, Kaufman R, et al. Societal cost of rheumatoid arthritis patients in the US. Curr Med Res Opin. 2010;26(1):77–90.
57. Trends in COPD (Chronic Bronchitis and Emphysema): Morbidity and Mortality. Chicago, IL: American Lung Association; 2013.
58. Ford E, Murphy L, Khavjou O, et al. Total and state-specific medical and absenteeism costs of copd among adults aged ? 18 years in the united states for 2010 and projections through 2020. Chest. 2015;147(1):31–45.
59. National Diabetes Statistics Report: Estimates of Diabetes and its Burden in the United States. Atlanta, GA: Centers for Disease Control Prevention, US Department of Health and Human Services; 2014.
60. Heidenreich P, Trogdon J, Khavjou O, et al. Forecasting the future of cardiovascular disease in the United States: a policy statement from the American Heart Association. Circulation. 2011;123(8):933–944.
61. United States Census Bureau. U.S. and world population clock. http://www.census.gov/popclock/. Published 2010. Accessed May 13, 2015.
62. Surveillance, Epidemiology, and End Results (SEER) Program. SEER Stat Fact Sheets: All Cancer Sites. http://seer.cancer.gov/statfacts/html/all.html. Published 2015. Accessed Februry 10, 2015.
63. Cancer Facts & Figures 2014. Atlanta, GA: American Cancer Society; 2014.