
Innov Clin Neurosci. 2026;23(10–12). Online ahead of print.
Roberto Gomeni, PhD; Françoise Bressolle-Gomeni, PhD; and Maurizio Fava, MD
Drs. Gomeni and Bressolle-Gomeni are with Pharmacometrica, La Fouillade, France. Dr. Fava is with Department of Psychiatry, Massachusetts General Hospital, and Harvard Medical School, Boston, Massachusetts.
Abstract: Randomized, placebo-controlled clinical trials (RCTs) are the gold-standard approach for assessing treatment effect (TE), typically defined as baseline-corrected difference in clinical scores between active and placebo arms. Uncontrolled baseline variation in individuals’ probability of exhibiting a nonspecific response to treatment (prob-NSRT) can introduce bias in the estimation of TEs, as conventional study designs and statistical methods generally fail to account for imbalances in such confounding factors. Recently, a novel methodology was proposed for assessing TE conditional to prob-NSRT estimated using artificial intelligence. The 1-(prob-NSRT) value was used as weight (propensity score weighted [PSW]) in a mixed model repeated measures (MMRM) analysis to assess TE by controlling the potential confounding effects of unbalanced baseline prob-NSRT distributions. Clinical trial simulations were conducted to explore multiple trial protocols (scenarios) and to identify alternative and more generalizable approaches for analyzing and reporting RCT results. The objective of this analysis was to compare the outcomes of PSW and the reference unadjusted analysis using simulated RCT data characterized by different baseline prob-NSRT distributions and to assess potential risk of inflating Type I/II errors. The simulations indicated that when using the unadjusted analysis, the risk of inflated Type I error increases with the increase of prob-NSRT and the risk of Type II error increases with the decrease of prob-NSRT. The PSW methodology achieved better control of baseline imbalance in nonspecific response distributions, yielding an estimated TE that was independent of prob-NSRT distributions. These findings provide convergent evidence highlighting the potential of PSW as the preferred approach for analyzing RCTs. Keywords: Artificial intelligence, nonspecific treatment response, placebo effect, propensity weighted analysis, clinical trial simulation
Introduction
The randomized placebo-controlled trial (RCT) is widely recognized as the gold standard approach for evaluating the efficacy and safety of new treatments and interventions. Randomization is expected to control for accidental and selection biases and to provide the basis for a reliable statistical inference. In the context of an RCT, the nonspecific response to treatment (NSRT) refers to a range of factors that could lead to improvements in a patient’s condition independent of the treatment’s active mechanism. These factors can include patient expectations, regression to the mean, natural disease progression, and other contextual or incidental influences surrounding the treatment. The NSRT is usually associated with inflated variability in the degree of response and clinical trial failures due to lack of assay sensitivity leading to an inflated Type II error.1
A higher placebo response rate was shown to be significantly correlated with a lower risk ratio of responding to active treatments vs placebo in an analysis conducted on 169 antidepressant monotherapy studies and 35 adjunctive studies.2 Therefore, the estimated treatment effect (TE; ie, baseline-corrected change from placebo) and effect size derived using the current statistical methodologies for analyzing RCTs have to be considered with caution, as these estimates are conditional to the unknown levels of the nonspecific response.
Furthermore, several meta-analyses indicated that a large number of RCTs conducted to investigate the efficacy of novel medications for central nervous system (CNS) diseases failed to assess the TE. The main reason for study failure was identified as the high and unpredicted levels of nonspecific response.3 The level of nonspecific response was identified as a critical prognostic factor for the assessment of TE in RCTs conducted in major depressive disorder (MDD).4,5 A meta-analysis conducted on 81 RCTs in MDD submitted to the United States Food and Drug Administration (FDA) showed that only 53% of the trials were successful in the last 25 years6 and that the placebo response rate was increasing over time.7,8
As a consequence, the individual level of nonspecific response can be classified as a relevant prognostic factor that cannot be ignored in any inference even when randomization has been deployed.9 The imbalances in the distributions of relevant prognostic factors have been shown to have a substantial effect on power, Type I error rate, and bias in a test for TE when analysis fails to adjust for relevant prognostic factors.10,11 The chance of detecting a real effect in RCTs was shown to increase with the adjustment of prespecified prognostic baseline factors,10,12 and recommendations have been made indicating that adjustments should be routinely incorporated into the analysis of randomized trials in the presence of baseline prognostic factors.13 For these reasons, the European Medicines Agency guidelines recommend investigators consider adjusting TE estimates for variables known a priori to be strongly related with outcome.14
Although the process of randomization ensures no confounding, it will not always be able to provide a perfect balance across baseline prognostic factors between treatment groups. In reality, there is no requirement for baseline balance for valid inference, but where imbalance occurs, the TE might not be precisely estimated.9 Furthermore, it has been advocated that even statistically insignificant imbalances in prognostic factor distributions can have a substantial effect on power, Type I/II error rate, and bias in a test for TE when analysis fails to adjust for that covariate.15
A propensity score weighted (PSW) methodology was recently proposed for assessing the TE conditional to the probability of NSRT (prob-NSRT).16–19 The presence of variable distributions of subjects with NSRT is expected to affect the chance to detect a TE. As a relevant prognostic factor, the individual prob-NSRT values are not ignorable and need to be factored in the analysis for assessing study results. Otherwise, the assessment of TE based on analysis not accounting for this risk factor will remain affected by an unknown estimation bias function of the unknown distribution and level of individual prob-NSRT.
The baseline prob-NSRT varies from individual to individual and study by study.20 No methodology is currently available for predicting the distribution of the individual prob-NSRT in a new RCT using historical data and for applying these predictions as inclusion criteria for stratifying the patients in new RCTs. Recently, a novel methodology was proposed for assessing TE conditional to a prob-NSRT value estimated using artificial intelligence (AI) applied to data generated in each RCT. The 1-(prob-NSRT) value was used as a weight in the linear mixed model repeated measures (MMRM) analysis (PSW) to assess TE by controlling the potential confounding effects of unbalanced prob-NSRT distributions.21
The objective of the present analysis was to investigate the impact of different distributions of prob-NSRT on the estimated TE and to identify alternative and more generalizable approaches for analyzing and reporting RCT results. With this purpose, a clinical trial simulation approach was used for generating multiple trial scenarios associated with different distributions of prob-NSRT and for evaluating how the different scenarios might affect trial performance and TE detection. At this purpose, 5 scenarios associated with different distributions of prob-NSRT were evaluated. Trial performance was assessed by comparing the distribution of study results evaluated with the PSW and the currently applied MMRM unadjusted analysis. For each simulation scenario, 20 in-silico trials were randomly generated using bootstrap-based simulations, and data of the same trial were analyzed using the PSW and the unadjusted approach for a head-to-head comparison of various scenarios.
Experimental Procedures
Data. The data of 2 RCTs (Studies 810 and 874) were used as templates for the trial simulations. The 2 studies were randomized, double-blind, parallel-group, placebo-controlled studies evaluating the efficacy and safety of paroxetine controlled release (12.5 mg/day and 25mg/day) vs placebo in patients with MDD. Study 810 (https://www.gsk-studyregister.com/trials/29060%2F810) was conducted in patients with ages ranging from 18 to 65 years, and Study 874 (https://www.gsk-studyregister.com/trials/29060%2F874) was conducted in elderly patients aged >60 years. The 2 trials were selected based on their similarities in key design factors, including depression severity at baseline (Hamilton Depression Rating Scale [HAMD-17] ≥23), number of treatment arms, dose strength, and year of conduction. Details on these studies have been previously reported.22
Modeling strategy. The analysis was conducted using a 6-step approach:
- Select the prerandomization data (ie, screening and baseline data used as potential predictors of NSRT) and select the end of study data (ie, data at 8 weeks to assess clinical response) in subjects randomized to placebo in each study.
- Define the criteria for a clinically relevant NSRT.
- Develop and validate an AI-based model for predicting the prob-NSRT at study-end in the placebo arm using prerandomization data.
- Predict the individual prob-NSRT using the model developed in step 3 applied to the prerandomization data of all subjects randomized in the studies (ie, subjects in the different treatment arms).
- Use trial simulation for exploring multiple trial protocols (scenarios) and to identify alternative and more generalizable approaches for analyzing and reporting RCT results
- Conduct a longitudinal analysis of each simulated trial using the weighted and nonweighted MMRM approaches to estimate the TE.
Because prob-NSRT is predicted exclusively from prerandomization individual characteristics, treatment assignment cannot influence its inputs. Randomization also supports comparable baseline covariate distributions across treatment arms. We therefore assume that the baseline relationship between these characteristics and latent nonspecific response is transportable from the placebo arm to the active-treatment arms.
Clinically relevant nonspecific response. The clinically relevant nonspecific response in placebo arm was defined using the score of the Clinician Global Impression-Improvement (CGI-I) scale, as this score represents a patient-independent assessment done by the clinician on the patient’s global disease severity prior to and after initiating the treatment. A CGI-I score between minimally improved (3) and much improved (2) was considered as an indicator of a clinically relevant response. This CGI-I score was associated to a percent reduction from baseline at Week 8 in the HAMD-17 total score of 41% using the equipercentile linking method.23,24 A binary score (0 or 1) was then associated to each subject in the placebo arm as an indicator of the absence or presence of a clinically relevant signal of response at study-end when the change from baseline of HAMD-17 total score was >41%.
AI analysis predictive model. The objective of the AI model was to identify prerandomization information predicting a clinically relevant NSRT at study-end and to apply this model to the prerandomization data of each subject in each treatment arm for predicting the individual prob-NSRT. Many potential predictors of the nonspecific response evaluated at baseline can be considered, such as demographic data, habits and quality of life, or disease-related information. For simplicity, we decided to limit our exploration to the 17 items of the HAMD-17 scale, as these items are assumed to capture specific and independent symptoms of depression.21,25,26
The AI predictive models were developed using the artificial neural network (ANN) methodology applied to the observed data collected in the placebo arm at screening, baseline, and study-end. The ANN analysis was conducted using the neuralnet library in R.27
The choice of the ANN model was based on a comparative analysis of the ANN performances previously conducted using different machine learning methodologies to estimate the individual probability of a nonspecific TE. The following methodologies were compared: gradient boosting machine, lasso regression, logistic regression, support vector machines, k-nearest neighbors, and random forests. In this comparison, the ANN methodology achieved the highest overall accuracy among all methods tested. In addition, to address the risk of overfitting, a 5-fold cross-validation was conducted on the best performing ANN model. This analysis confirmed the performances and indicated the limited risk of overfitting of the best performing ANN model.36
A formal procedure for the ANN model development and validation was applied. According to this procedure, the available placebo data were split into 3 datasets:
- Training set, used for ANN model development (this dataset included 75% of the data in the placebo arm randomly selected).
- Validation set, used to assess model performances (this dataset included the 25% of data in placebo arm not used for model development).
- Working dataset, with the full dataset including all the subject data in the 3 arms together with the individual estimate of the propensity probability estimated using the ANN model applied to the prerandomization data of each subject in each treatment arm.
AI model validation. The predictive performances of the AI models were assessed using:
- Area under the receiver operating characteristic (ROC) curves (AUCs) with the 95% confidence intervals (CIs). The larger the ROC AUC, the better the predictive performance of the model. AUC of 1.0 is associated with the ideal predictor because it achieves both 100% sensitivity and 100% specificity. AUC of 0.5 is associated with a poor predictor, with 50% sensitivity and 50% specificity. A reliable and informative predictor should have an AUC statistically larger than 0.5.
- Sensitivity: ratio of true positives to total positives in the data.
- Specificity: ratio of true negatives to total negatives in the data
- Accuracy: number of correct predictions as a fraction of total predictions.
- Precision: fraction of correct positive predictions.
In addition to the ROC AUC and the other criteria previously defined, model calibration was assessed to evaluate agreement between predicted probabilities and observed outcome frequencies.
Calibration plots were constructed by grouping observations according to their predicted probabilities and plotting the mean predicted probability against the corresponding observed event rate. A perfectly calibrated model would have all points lying along the zero intercept and unitary slope, corresponding to the line of perfect agreement between predicted and observed probabilities.
Overall calibration performance was further summarized using the Brier score (BS), defined as the mean squared difference between the predicted probabilities and the observed binary outcomes:
[BS=(1/N) Σ (pi−oi)2]
where pi is the predicted probability for observation i, oi is the observed outcome (0 or 1), and N is the total number of observations. The BS ranges from 0 (perfect prediction) to 1 (worst possible prediction), and jointly reflects both discrimination and calibration. Lower values indicate better overall predictive performance.
Clinical trial simulation analysis. Clinical trial simulations were conducted using the bootstrap methodology to explore multiple trial protocols (scenarios) and to identify alternative and more generalizable approaches for analyzing and reporting RCT results.
The bootstrapping methodology was used to generate “synthetic” RCT datasets that mimic the statistical properties of the original data, preserving the dependency between prerandomization and end-of study data. This approach, based on a Monte Carlo technique, does not require the knowledge of mechanisms explaining the clinical response, and constructs synthetic samples by resampling with replacement from the observed experimental sample.28–30 The resampling strategy was applied to evaluate the influence of different baseline prob-NSRT distributions on the bias and precision of the estimate TE. In each simulated RCT, the longitudinal HAMD-17 scores were bootstrapped (ie, resampled with replacement) using the observed scores in the 810 and 874 trials.
The simulation was organized into 5 steps:
- Individual baseline prob-NSRT was estimated for each subject included in the 810 and 874 trials using the AI model applied to the screening and baseline HAMD-17 scores.
- The impact of different distributions of prob-NSRT on the estimated TE was evaluated in 5 simulation scenarios. Each scenario was characterized by different proportions of subjects in the 4 classes of prob-NSRT (class 1: <0.25%, class 2: 0.25–0.5%, class 3: 0.5–0.75%, and class 4: >0.75%). A total of 510 subjects were included in each simulated RCT. The subjects were randomly allocated in each simulation scenario according to the following criteria:
-
Scenario 5 (S5): 25% of subjects in each class
-
Scenario 4 (S4): 45% of subjects in class 4 (>0.75%)
-
Scenario 3 (S3): 35% of subjects in class 4 (>0.75%)
-
Scenario 2 (S2): 45% of subjects in class 1 (<0.25%)
-
Scenario 1 (S1): 35% of subjects in class 1 (<0.25%)
The same proportion of subjects was allocated in the remaining classes for scenarios 1 to 4 for a total of 170 subjects per arm. This sample size was selected based on the sample size of Study 874.
-
- Each simulated RCT included 170 subjects per arm (placebo, 12.5 mg, and 25 mg). The longitudinal HAMD-17 scores of each subject in a given treatment arm were bootstrapped from the observed longitudinal scores in Studies 810 and 874 using the prob-NSRT values previously estimated. For example, in the simulation conducted using the 810 trial as template, the HAMD-17 scores of 170 subjects included in the 12.5 mg arm for S5 were randomly sampled (with replacement) from the HAMD-17 scores of the 12.5 mg arm observed in the 810 trial by resampling 42 subjects (ie, 25% of the total subjects=170) with prob-NSRT in class 1 (prob-NSRT <0.25%), 42 subjects with prob-NSRT in class 2 (prob-NSRT: 0.25–0.5%), 42 subjects in class 3 (prob-NSRT: 0.5–0.75%), and 42 subjects in class 4 (prob-NSRT: >0.75%). Each trial was replicated 20 times to provide a reliable estimate of the typical TE in each scenario given the random selection procedure applied. The “sample” function in R was used in the random subject selection.25
- Two MMRM analyses were conducted on the data of each scenario using the PSW and the unadjusted methodology for a head-to-head comparison of the performances of the various randomization designs.
- Summary statistics were provided on the TE values estimated in each scenario, study, and arm.
Longitudinal analysis. The 1-(prob-NSRT) value was used as weight in the MMRM model for longitudinal data in the PSW analysis. No weight was used in the MMRM model in the unadjusted analysis. The MMRM analysis was conducted using the PROC MIXED procedure (Version 9.4; SAS Institute, Carry, NC, US). The 2 analyses (PSW and unadjusted) were conducted on the HAMD-17 total score changes from baseline using a random effect on the change from baseline, an unstructured covariance matrix, time as a classification variable, baseline measurement as a covariate, baseline × time interaction, and treatment × time interaction. The PSW methodology was implemented using the same MMRM model used in the unadjusted analysis with the additional use of the “Weight” option [set to the estimated 1-(prob-NSRT)]. The TE was estimated as the difference in the least mean square between arm1, arm2, and placebo at Week 8 using the MMRM-based point estimates (ie, least square means, 95% CIs, and P values). A level of α=0.05 was used to establish the significance of the TE.
Results
In the 810 study, the number of subjects included and the mean (standard deviation [SD]) baseline HAMD-17 total score in placebo, 12.5 mg, and 25 mg arms were 148, 23.5 (3.3); 153, 23.2 (2.9); and 146, 23.8 (3.2), respectively. In the 874 study, the number of subjects and the mean (SD) baseline HAMD-17 total in placebo, 12.5 mg, and 25mg arms were 161, 22.6 (3.6); 173, 23.1 (3.9); and 178, 22.7 (4.0), respectively.
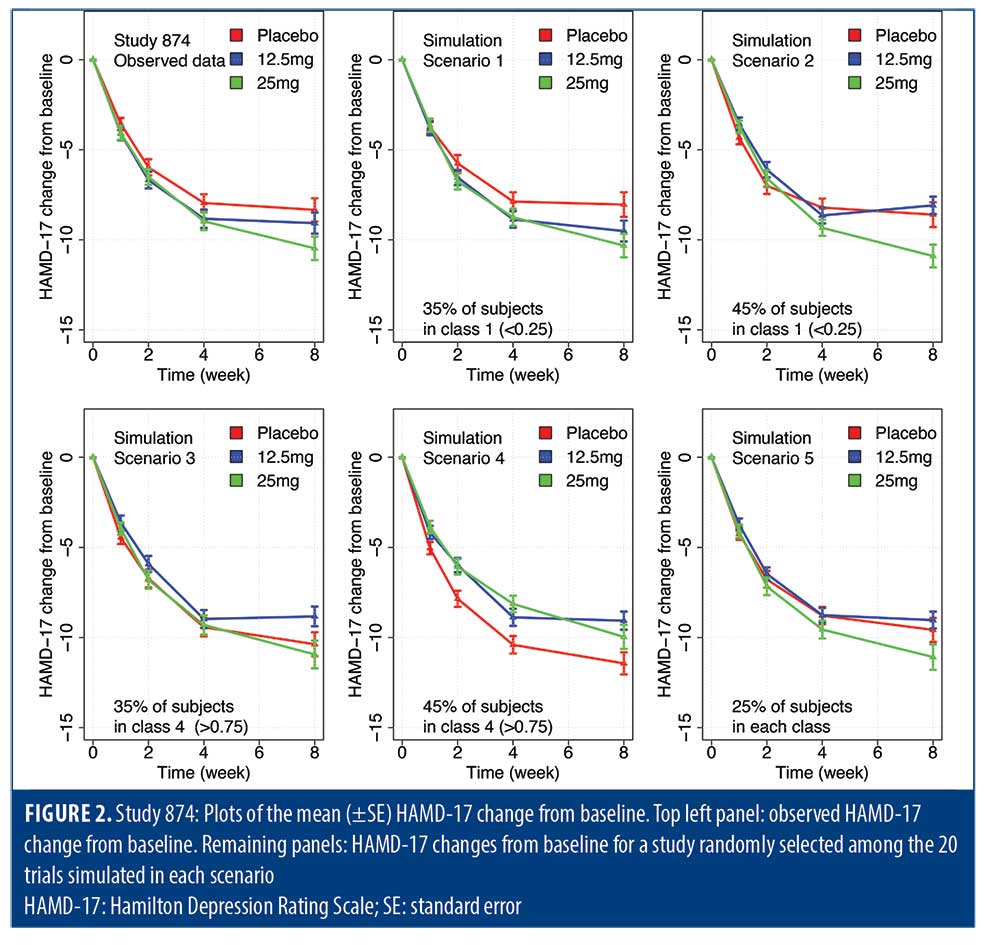
The plots of mean (±standard error [SE]) observed longitudinal HAMD-17 changes from baseline scores by treatment arm are presented in the upper left panel of Figures 1 and 2 for Studies 810 and 874, respectively.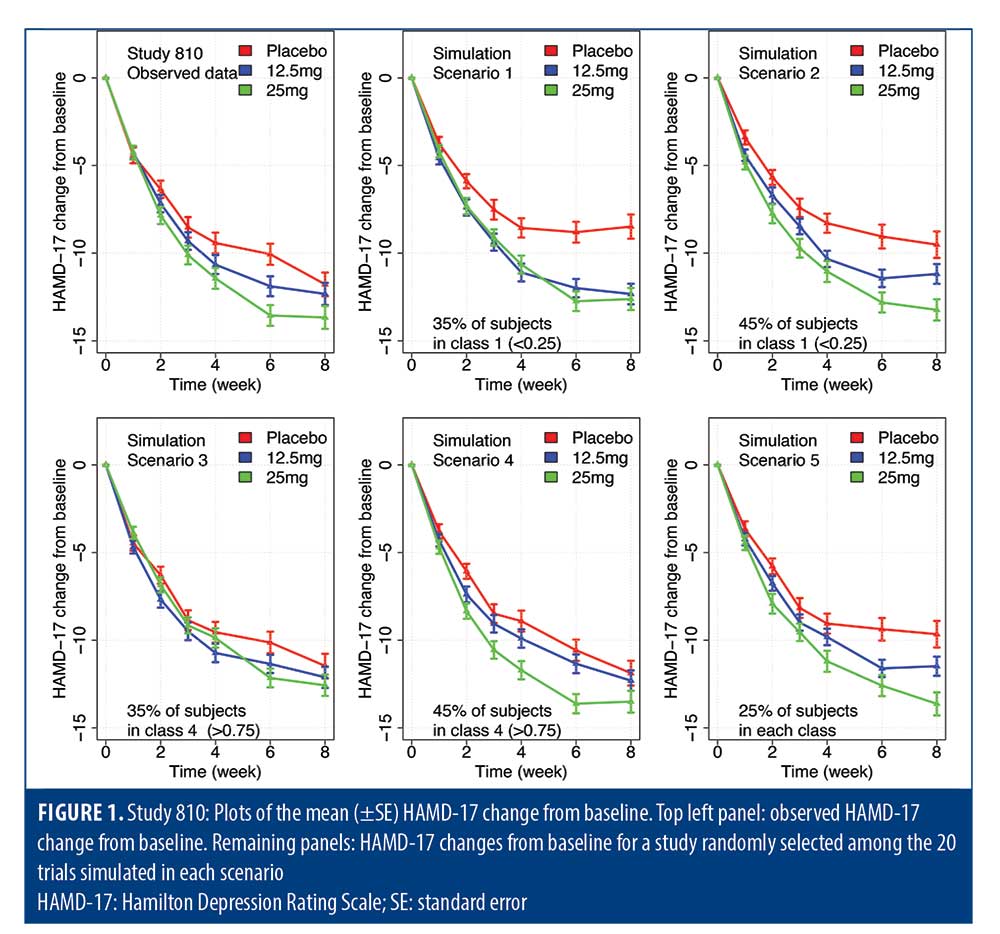
AI model. The implementation of an ANN model requires the definition of 2 hyperparameters that control the topology of the network: the number of hidden layers and the number of nodes in each hidden layer. A preliminary grid search analysis was conducted to identify these parameters. This analysis indicated that the optimal number of layers for the 810 study was 3 and the optimal number of nodes per layer was 12, 6, and 5, respectively. For Study 874, the optimal number of layers was 3 and the optimal number of nodes per layer was 10, 13, and 3, respectively. The optimality criteria was based on the best predictive performance of the models.
All validation criteria indicated the good predictive performances of the models. Study 810 had a ROC AUC (95% CI) of 0.81 (0.64–0.97), specificity of 0.88, sensitivity of 0.75, accuracy of 0.79, and precision of 0.94. Study 874 had a ROC AUC (95% CI) of 0.88 (0.77–1.00), specificity of 0.91, sensitivity of 0.83, accuracy of 0.88, and precision of 0.88. The ROC AUC values were statistically greater than the noninformative threshold of 0.5 according to the 95% CI. Therefore, the ANN models were considered appropriate for predicting the individual prob-NSRT using the pretreatment data in each treatment arm of the 2 RCTs.
The agreement between predicted probabilities and observed outcome frequencies was assessed using the BS and the calibration curve estimated on the combined data of Studies 810 and 874. The BS was 0.24. The calibration intercept was −0.01 (SE: 0.13; 95% CI: −0.33 to 0.31), and the calibration slope was 0.77 (SE: 0.20; 95% CI: 0.27–1.26). The calibration intercept was not significantly different from 0, and the calibration slope was not significantly different from 1, indicating no statistically significant evidence of systematic miscalibration.
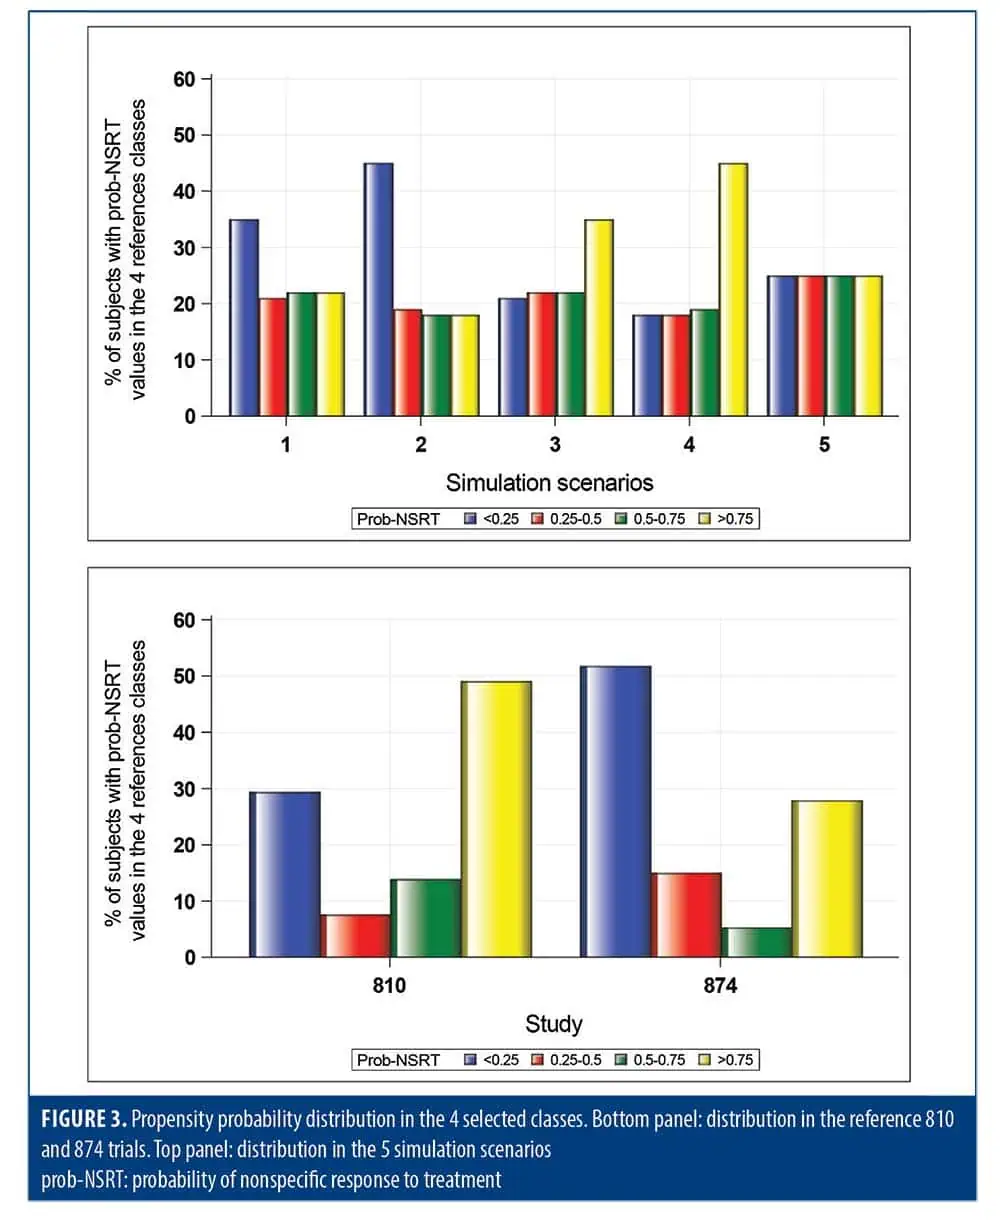
The percentage of subjects with an estimated prob-NSRT in the intervals <0.25, 0.25 to 0.50, 0.50 to 0.75, and >0.75 is presented by study in Figure 3 (bottom panel).
The distribution of prob-NSRT indicated a different pattern of response in the 2 trials. The large majority of the subjects in Study 810 had a high prob-NSRT (>0.75) leading to a potentially inflated Type II error (false negative) by underestimating the TE. On the contrary, the large majority of the subjects in Study 874 had a low prob-NSRT (<0.25) leading to a potentially inflated Type I error (false positive) by overestimating the TE. The distribution of prob-NSRT in the 4 classes (<0.25, 0.25–0.50, 0.50–0.75, and >0.75) applied to the 5 simulation scenarios is presented in Figure 3 (top panel).
The plots of the mean (±SE) longitudinal HAMD-17 changes from baseline scores observed and by simulation scenario are presented in Figures 1 and 2 for Studies 810 and 874. In these figures, the top left panels present the observed change from baseline and the remaining 5 panels present the HAMD-17 changes from baseline for a study randomly selected among the 20 trials simulated.
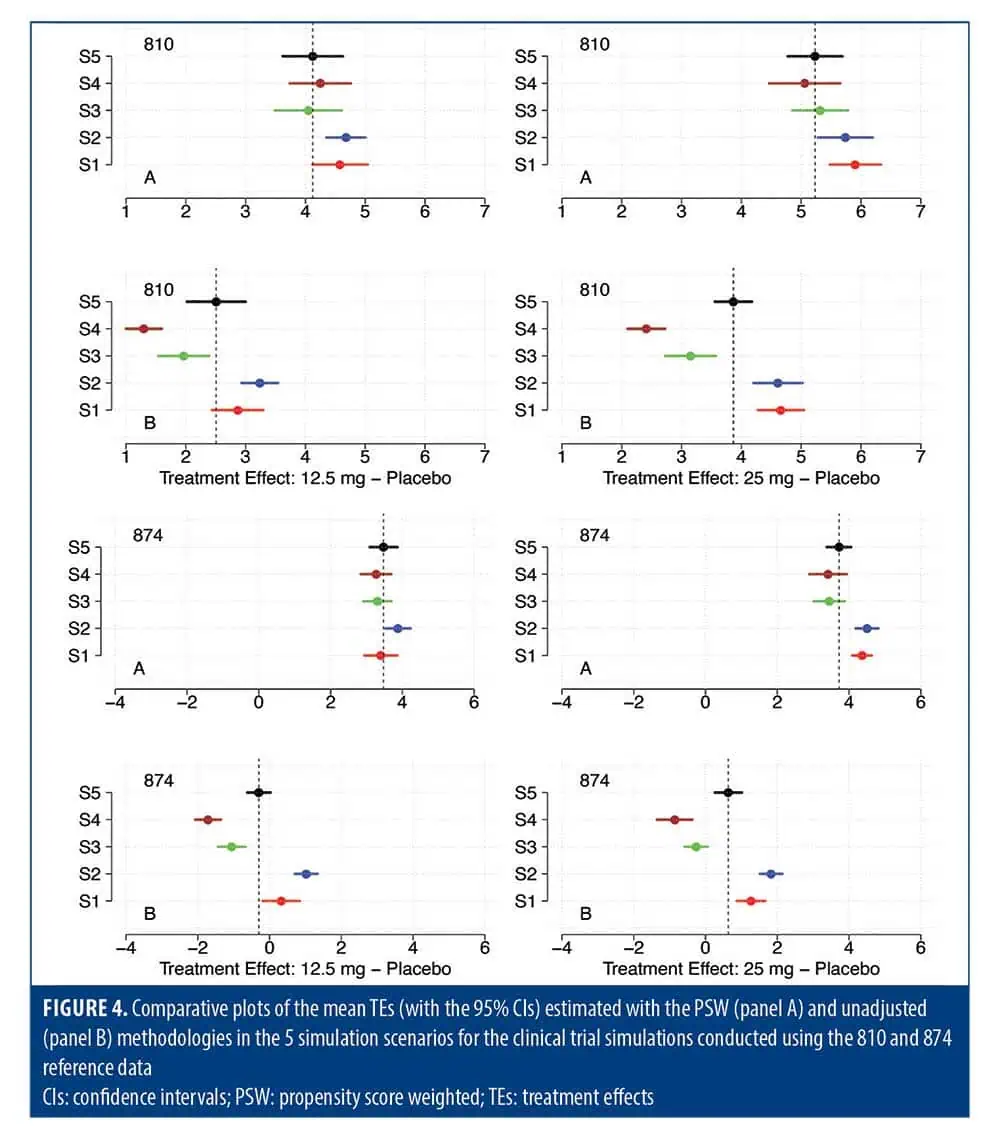
The comparative plots of the mean TEs (with the 95% CIs) estimated with the PSW and unadjusted methodologies in the 5 simulation scenarios conducted using the 810 and 874 reference data are presented in Figure 4.
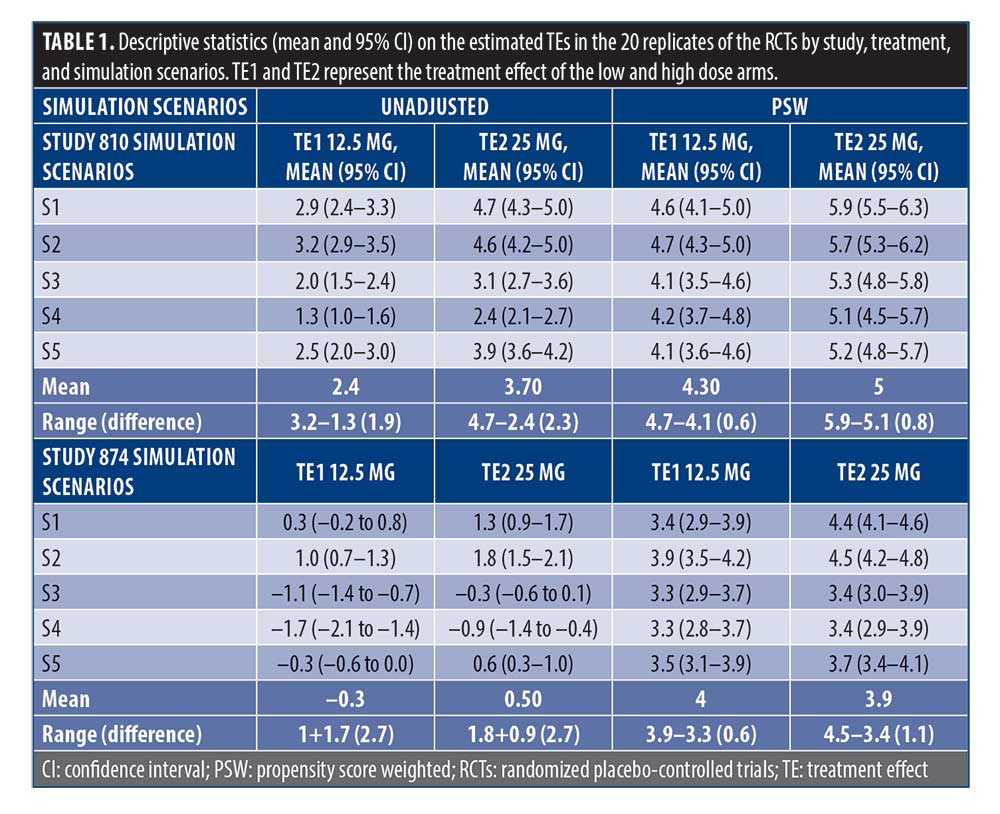
The descriptive statistics (mean and 95% CIs) on the estimated TEs in the 20 replicates of the RCTs by simulation scenarios are presented in Table 1.
In the unadjusted analysis, the TE estimates were statistically different in the different simulation scenarios according to the nonoverlapping 95% CIs (Table 1). In Study 810, TE ranged from 1.3 to 3 for TE1 and from 2.4 to 4.7 for TE2; in Study 874, TE ranged from –0.3 to 1.7 for TE1 and from –0.9 to 1.8 for TE2. In the 2 RCTs, the greater the number of subjects in class 4 (prob-NSRT >0.75), the lower the estimated TE value, and the greater the number of subjects in class 1 (prob-NSRT <0.25), the greater the estimated TE value.
These results indicate that statistically different TE values can be estimated using the conventional MMRM analysis in the presence of specific distribution of prob-NSRT. Based on the currently applied unadjusted methodology, we did not dispose of any tool for assessing the baseline distribution of prob-NSRT. As a consequence, different TE values can be estimated in different RCTs hypothetically conducted with the same protocol but in presence of different baseline distribution of prob-NSRT.
In the PSW analysis, the TE estimates were very close and not statistically different in the different simulation scenarios according to the overlapping 95% CIs reported in Table 1. In Study 810, TE ranged from 4.1 to 4.7 for TE1 and from 5.1 to 5.9 for TE2; in Study 874, TE ranged from 3.3 to 3.9 for TE1 and from 3.4 to 4.5 for TE2. In the 2 RCTs, the TEs estimated were substantially insensitive to the distribution of prob-NSRT in classes 4 and 1.
To quantify individual predictors’ relevance (ie, the 17 items of the HAMD-17 scale) and identify clinically actionable thresholds, an analysis was conducted using the relative importance methodology. Relative importance of input variables in an ANN network was defined as the sum of the product of raw input-hidden, hidden-output connection weights.35 The relative importance was expressed as a value ranging from 0% (no importance) to 100% (maximal importance). The plots of the relative importance of the individual features (the 17 individual items of the HAMD-17 scale) for the prediction of the probability of nonspecific TE by study is presented in Figure S1. The results of the relative importance analysis revealed distinct patterns in how individual HAMD-17 item scores contributed to predicting nonspecific TE across the 2 studies. This finding indicates that results from one study might not be directly applicable to another, highlighting the need for each study to be evaluated independently.
Discussion
The development of new treatments for CNS disorders has become increasingly challenging due to the enormous failure rates in Phase 2/3 trials with poor separation of treatment-related efficacy from placebo. Often, effective treatments used as positive control also fail to distinguish from placebo, with a rate of RCT failure of about 50%.31 As the drug development environment has become more competitive, risky, and demanding, there has been an increasing need for more accurate methodologies for an early assessment of a drug candidate’s efficacy.
The FDA has recognized the inefficiency in drug development and proposed model-based drug development to improve pharmaceutical productivity and decision-making. Modeling and simulation provide a powerful tool to summarize and integrate information from different studies. Application of modeling and simulation can help decision-making, design better studies, reduce costs, save time, and ultimately improve success rates.32,33
The primary objective of the present article was to use clinical trial simulation for comparing the performances of PSW and conventional unadjusted methodologies for the analysis of RCTs accounting for the impact of different distributions of the individual nonspecific TE. The additional objectives were to assess potential risk of inflating Type I/II errors due to unbalanced baseline distributions of prognostic factors and to evaluate if the PSW methodology could represent an alternative and more generalizable approach for analyzing and reporting RCT results.
A different and heterogeneous baseline distribution of the NSRT was initially observed in the 810 and 874 studies (Figure 2), indicating that the conventional randomization process used to include patients in the trials was unable to ensure a balanced baseline distribution of this relevant prognostic factor. In this scenario, the groups to be compared were imbalanced and thus incomparable due to baseline differences not accounted for in the unadjusted analysis.
The results of the analyses (mean TEs estimated across the 20 replicates of the RCTs reported in Figure 4 and Table 1) show a strong association between the baseline distribution of prob-NSRT and the estimated TEs in the unadjusted analysis, whereas this association was not observed in the PSW analysis.
Figure 4 reports the TE values estimated from the analysis of the simulated data from the 20 RCTs. Among the 5 simulation scenarios, the results of S5 are considered the reference values, as they were obtained under the assumption of an equal baseline distribution of prob-NSRT among subjects enrolled in the 3 treatment arms. Comparing the TE values estimated under higher and lower baseline prob-NSRT distributions provides an indication of the potential impact of baseline prob-NSRT distribution on the estimated TE.
Specifically, as shown in Table 1, S3 and S4 indicate that higher baseline prob-NSRT distributions are associated with an increased risk of inflated TE estimates, whereas S1 and S2 indicate that lower baseline prob-NSRT distributions are associated with an increased risk of deflated TE estimates. Importantly, these results do not imply that the distribution of baseline prob-NSRT directly changes the Type I or Type II error rates. Rather, they indicate that the magnitude and direction of the estimated TE in the unadjusted analysis are conditioned by the underlying baseline distribution of prob-NSRT. Because this distribution is generally unknown and is not accounted for in the unadjusted analysis, the resulting TE estimates should therefore be interpreted with caution. In contrast, the PSW analysis appears to mitigate this dependence on the baseline prob-NSRT distribution.
In contrast to the conventional analysis approach, the PSW methodology provided a better control for the baseline imbalance of relevant prognostic factors (prob-NSRT) and provided an adjusted estimate of TE. The PSW methodology assumes that the NSRT varies from individual to individual, and that prob-NSRT can be estimated using an ANN model applied to the prerandomization data.
The major difference and advantage of the PSW methodology with respect to the historical study design and/or analysis procedures is that the PSW method provides an unbiased strategy to associate to the observations collected in each subject a weight accounting for the potential confounding factor of a nonspecific response. The comparison of the results of the analysis with and without propensity weight indicated that the PSW analysis was able to account for the baseline individual probability of a nonspecific response, resulting in an estimate of the TE significantly larger than the TE estimated with the conventional methodology.
Limitations. The main limitation of the PSW methodology was that the ANN model was developed and applied to analyze data in the same dataset. To overcome this limitation, a new AI-driven mixed effect implementation (AI-NLME) was recently proposed.34 This approach involves the development of the ANN model using a placebo dataset that is independent from the placebo dataset used to estimate the TE. The independent placebo dataset was generated by randomly split 50% of the data of the placebo arm in 2 working datasets, the first one used for model development/validation and the second one used for the estimation of the treatment effect jointly with the data collected in the other arms of the RCT.
Our analysis was deliberately restricted to the use of the HAMD-17 items as predictors because these items have been shown to capture specific and independent symptoms of depression and to provide informative estimates of the individual probability of nonspecific response. This approach also allowed us to focus specifically on the information contained in depressive symptom profiles while keeping the model relatively simple and interpretable.
We acknowledge, however, that other prerandomization variables—including CGI-Severity, demographic characteristics, treatment history, functioning, study site, and other clinical measures—could provide additional information regarding the expected probability of nonspecific response. An expanded model incorporating these variables could therefore determine whether they provide incremental predictive information beyond that captured by the HAMD-17 items. We consider this an important direction for future research and agree that such an analysis would help further evaluate the robustness and generalizability of the proposed approach.
Other limitations are the restricted number of simulation scenarios and the limited number of replicated RCTs used in the simulations. However, despite these limitations, the simulations conducted indicated that when applying the conventional statistical methodology, the risk of an inflated Type I error increases with the increase of prob-NSRT and the risk of Type II error increases with the decrease of prob-NSRT; and the PSW approach better controls for the baseline unbalance of prob-NSRT and provides estimates of treatment effect substantially insensitive to the prob-NSRT distributions.
The results of the trial simulation suggest that the PSW methodology can be prospectively applied to any RCT designed and conducted using conventional methodologies when: i) the RCT was designed to collect screening and baseline data, ii) the criteria for assessing the clinical response to placebo were prespecified in the analysis plan, and iii) the criteria for implementing and qualifying the predictive performance of the ANN model were defined in the analysis plan.
Conclusion
The clinical trial simulations indicated that the unadjusted analysis inflated the risk of Type I error with the increase of prob-NSRT and increased the risk of Type II error with the decrease of prob-NSRT. Overall, the PSW methodology achieved better control of baseline imbalance in the nonspecific response distribution, yielding an estimated TE that was independent of prob-NSRT distributions. These findings provide convergent evidence highlighting the potential of PSW as the preferred approach for analyzing placebo-controlled clinical trials.
Supplementary Material
To access the Supplementary Material, please visit https://innovationscns.com/wp-content/uploads/Gomeni-supplementary-material.pdf.
Author Contributions
RG: conceptualization, formal analysis, methodology, writing—original draft. FBG: writing, reviewing and editing. MF: conceptualization, writing, reviewing and editing.
References
- Evans K, Colloca L, Pecina M, Katz N. What can be done to control the placebo response in clinical trials? A narrative review. Contemp Clin Trials. 2021;107:106503.
- Iovieno N, Papakostas GI. Correlation between different levels of placebo response rate and clinical trial outcome in major depressive disorder: a meta-analysis. J Clin Psychiatry. 2012;73(10):1300–1306.
- Benedetti F, Pollo A, Lopiano L, et al. Conscious expectation and unconscious conditioning in analgesic, motor, and hormonal placebo/nocebo responses. J Neurosci. 2003;23(10):4315–4323.
- Khan A, Detke M, Khan SR, Mallinckrodt C. Placebo response and antidepressant clinical trial outcome. J Nerv Ment Dis. 2003;191(4):211–218.
- Li Y, Huang J, He Y, et al. The impact of placebo response rates on clinical trial outcome: a systematic review and meta-analysis of antidepressants in children and adolescents with major depressive disorder. J Child Adolesc Psychopharmacol. 2019;29(9):712–720.
- Khin NA, Chen YF, Yang Y, et al. Exploratory analyses of efficacy data from major depressive disorder trials submitted to the US Food and Drug Administration in support of new drug applications. J Clin Psychiatry. 2011;72(4):
464–472. - Gopalakrishnan M, Zhu H, Farchione TR, et al. The trend of increasing placebo response and decreasing treatment effect in schizophrenia trials continues: an update from the US Food and Drug Administration. J Clin Psychiatry. 2020;81(2):19r12960.
- Tuttle AH, Tohyama S, Ramsay T, et al. Increasing placebo responses over time in U.S. clinical trials of neuropathic pain. Pain. 2015;156(12):2616–2626.
- Senn SJ. Seven myths of randomisation in clinical trials. Stat Med. 2013;32(9):1439–1450.
- Ciolino JD, Martin RH, Zhao W, et al. Measuring continuous baseline covariate imbalances in clinical trial data. Stat Methods Med Res. 2015;24(2):255–272.
- Senn SJ. Covariate imbalance and random allocation in clinical trials. Stat Med. 1989;8(4):467–475.
- Thompson DD, Lingsma HF, Whiteley WN, et al. Covariate adjustment had similar benefits in small and large randomized controlled trials. J Clin Epidemiol. 2015;68(9):1068–1075.
- Kahan BC, Jairath V, Doré CJ, Morris TP. The risks and rewards of covariate adjustment in randomized trials: an assessment of 12 outcomes from 8 studies. Trials. 2014;15:139.
- Guideline on adjustment for baseline covariates in clinical trials. European Medicines Agency. 26 Feb 2015. Accessed 8 Jul 2025. https://www.ema.europa.eu/en/documents/scientific-guideline/guideline-adjustment-baseline-covariates-clinical-trials_en.pdf
- Senn SJ. Testing for baseline balance in clinical trials. Stat Med.1994;13(17):1715–1726.
- Williamson EJ, Forbes A, White IR. Variance reduction in randomised trials by inverse probability weighting using the propensity score. Stat Med. 2014;33(5):721–737.
- Austin PC, Stuart EA. Moving towards best practice when using inverse probability of treatment weighting (IPTW) using the propensity score to estimate causal treatment effects in observational studies. Stat Med. 2015;34(28):3661–3679.
- Andrew BY, Brookhart AM, Pearse R, et al. Propensity score methods in observational research: brief review and guide for authors. Br J Anaesth. 2023;131(5):805–809.
- Austin PC. An introduction to propensity score methods for reducing the effects of confounding in observational studies. Multivariate Behav Res. 2011;46(3):399–424.
- Zeng S, Li F, Wang R, Li F. Propensity score weighting for covariate adjustment in randomized clinical trials. Stat Med. 2021;40(4):842–858.
- Gomeni R, Bressolle-Gomeni F, Fava M. Artificial intelligence approach for the analysis of placebo-controlled clinical trials in major depressive disorders accounting for individual propensity to respond to placebo. Transl Psychiatry. 2023;13(1):141.
- Gomeni R, Goyal N, Bressolle F, Fava M. A novel methodology to estimate the treatment effect in presence of highly variable placebo response. Neuropsychopharmacology. 2015;40(11):2588–2595.
- Leucht S, Fennema H, Engel RR, et al. What does the MADRS mean? Equipercentile linking with the CGI using a company database of mirtazapine studies. J Affect Disord. 2017;210:287–293.
- Leucht S, Fennema H, Engel RR, et al. Translating the HAM-D into the MADRS and vice versa with equipercentile linking. J Affect Disord. 2018;226:326–331.
- Gomeni R, Bressolle-Gomeni F, Fava M. A new method for analyzing clinical trials in depression based on individual propensity to respond to placebo estimated using artificial intelligence. Psychiatry Res. 2023;327:115367
- Gomeni R, Hopkins CS, Bressolle-Gomeni F, Fava M. Interpreting clinical trial outcomes complicated by placebo response with an assessment of false-negative and true-negative clinical trials in depression using propensity-weighting. Transl Psychiatry. 2023;13(1):388.
- The R Project for Statistical Computing. R Foundation for Statistical Computing, Vienna, Austria. Accessed 8 Jul 2025. https://www.R-project.org/
- Efron B, Tibshirani RJ. An Introduction to the Bootstrap. Chapman & Hall; 1993.
- Johnson RW. An introduction to the bootstrap. Teach Stat. 2001;23(2):49–54.
- Collins GS, Ogundimu EO, Altman DG. Sample size considerations for the external validation of a multivariable prognostic model: a resampling study. Stat Med. 2016;35(2):
214–226. - Turner EH, Matthews AM, Linardatos E, et al. Selective publication of antidepressant trials and its influence on apparent efficacy. N Engl J Med. 2008;358(3):252–260.
- Critical path opportunities report. US Food and Drug Administration. Current as of 11 Apr 2025. Accessed 8 Jul 2025. https://www.fda.gov/science-research/science-and-research-special-topics/critical-path-initiative
- Successes and Opportunities in Modeling & Simulation for FDA. US Food and Drug Administration. Current as of 16 Nov 2022. Accessed 8 Jul 2025. https://www.fda.gov/science-research/about-science-research-fda/modeling-simulation-fda
- Gomeni R, Bressolle-Gomeni F. AI-NLME: a new artificial intelligence-driven nonlinear mixed effect modeling approach for analyzing longitudinal data in randomized placebo-controlled clinical trials. Clin Transl Sci. 2025;18(9):e70345.
- Olden JD, Joy MK, Death RG. An accurate comparison of methods for quantifying variable importance in artificial neural networks using simulated data. Ecol Model. 2004;178(3–4):389-397.
- Gomeni R, Bressolle-Gomeni F. Comparison of different machine learning methodologies for predicting the non-specific treatment response in placebo controlled major depressive disorder clinical trials. Clin Transl Sci. 2025;18(1):e70128.