Dr. Citrome is Clinical Professor of Psychiatry and Behavioral Sciences at New York Medical College in Valhalla, New York, and is the Editor-in-Chief for the International Journal of Clinical Practice, published by Wiley-Blackwell. He is also a member of the World Association of Medical Editors, the International Society for Medical Publication Professionals, and a participant in the Medical Publishing Insights and Practices initiative.
Innov Clin Neurosci. 2014;11(5–6):26–30
Funding: No funding or external editorial assistance was provided for the production of this article.
Financial Disclosures: In the past 36 months Dr. Citrome has engaged in collaborative research with, or received consulting or speaking fees, from: Alexza, Alkermes, AstraZeneca, Avanir, Bristol-Myers Squibb, Eli Lilly, Forest, Forum (Envivo), Genentech, Janssen, Jazz, Lundbeck, Medivation, Merck, Mylan, Novartis, Noven, Otsuka, Pfizer, Reckitt Benckiser, Reviva, Shire, Sunovion, Takeda, Teva, and Valeant.
Key words: Clinical relevance, Cohen’s d, effect size, number needed to treat, P-value
Abstract
Communicating clinical trial results should include measures of effect size in order to quantify the clinical relevance of the results. P-values are not informative regarding the size of treatment effects. Cohen’s d and its variants are often used but are not easy to understand in terms of applicability to day-to-day clinical practice. Number needed to treat and number needed to harm can provide additional information about effect size that clinicians may find useful in clinical decision making, and although number needed to treat and number needed to harm are limited to dichotomous outcomes, it is recommended that they be considered for inclusion when describing clinical trial results. Examples are given using the fictional antipsychotic medications miracledone and fantastapine for the treatment of acute schizophrenia.
The Scenario
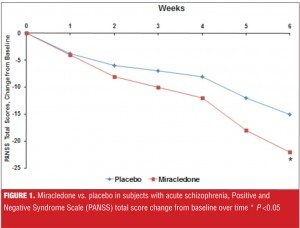
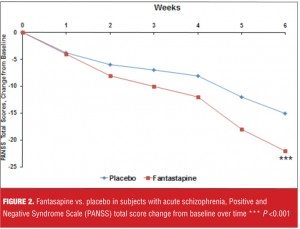
Suppose you are being told about a new antipsychotic, miracledone, that demonstrated superiority over placebo in the treatment of acute schizophrenia, as measured by the Positive and Negative Syndome Scale (PANSS) total score, in a well-conducted, six-week, randomized, controlled trial, and where the P-value was less than 0.05 (Figure 1). You are then told that another new agent, fantastapine, beat placebo in a similarily designed trial and that the P-value was less than 0.001 (Figure 2). Which agent sounds like the better one: miracledone or fantastapine?
The Trap
Assuming equivalent tolerability, cost, and overall patient acceptability, many people will say fantastapine looks better because the P-value is lower. However, all a P-value tells us is about statistical significance—the lower the P-value, the more convinced we are that the results observed are less likely due to chance, and thus we must be dealing with “the truth.”
Unfortunately, “the truth” may not be clinically relevant or clinically significant. Despite the impressive efforts that are made to demonstrate statistical superiority of one intervention versus another (or placebo), insufficient attention is given to the clinical relevance or clinical significance of the outcomes. Distressingly, obtaining a P-value less than 0.05 becomes the goal in order to have a paper be of interest to journal editors and deemed worthy of publication (for a brief cartoon that demonstrates this type of obsessional behavior, please see https://www.youtube.com/watch?v=KBALRk2hjMs).
What Is An Effect Size?
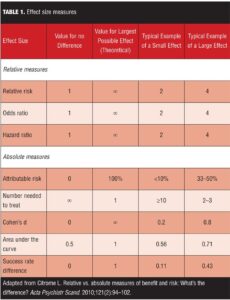
The effect size of a treatment represents how large a clinical response is observed.[1-3] Table 1 lists commonly used effect size measures. For continuous outcome measures such as point change on a rating scale, the effect size can be standardized so that it is easier to compare treatment effects in a meta-analysis. Cohen’s d and its variants are often used. For categorical outcomes, such as whether or not response or remission was achieved, proportions can be directly compared by simple subtraction to calculate the effect size difference. The reciprocal of this difference in proportions is the “number needed to treat” (NNT), a number that is clinically intuitive and helps relate the effect size difference back to the realities of clinical practice. Number needed to harm (NNH) is used to describe an outcome that is undesirable.
Paging Dr. Cohen
Cohen’s d is one of the most frequently encountered effect size metrics and is used to express the absolute difference between two groups using standard deviation units.[4] Although a generally accepted the rule of thumb is that a Cohen’s d of 0.2 represents a small effect size, 0.5 a medium effect size, and 0.8 a large effect size,1 this interpretation may not necessarily apply when evaluating treatments for complex disorders that are difficult to manage. It is possible that a “small” effect size is the state of the art for treatments for some diseases. Not known to many is that this ‘t-shirt size’ classification of effect size magnitude was based on observations of the different heights of teenage girls, and thus quite aribitrary.[5,6]
An interactive web-based visualization of the Cohen’s d effect size is available at http://rpsychologist.com/d3/cohend/.[7] By using an easy ‘slider’ tool, the viewer can see graphically what a specific Cohen’s d means in terms of differences between groups and the probability of superiority. There is also a handy conversion into NNT. The latest version of the visualization also allows the user to set the ‘Control Event Rate’ in order to more accurately estimate the NNT.[8] Particularly striking is how two distributions overlapped for ‘large’ effects. For a Cohen’s d of 0.2, the overlap was 92 percent, for 0.5 it was 80 percent, for 0.8 it was 69 percent, and for 1.5 it was five percent[7].
Returning to our example of miracledone and fantastapine, suppose we are told that the Cohen’s d for the difference between miracledone and placebo at Week 6 for the change on the PANSS total score was 0.5, and that for fantastapine 0.3; this would possibly be an important difference in favor of miracledone, despite the P-values.
NNT
Although Cohen’s d values are often used, this metric is not clinically intuitive. Among the other absolute effect size measures, such as area under the curve, success rate difference, attributable risk, and NNT,[3] NNT is arguably the most easy to calculate and understand,[9] and helps relate effect size difference back to real-world concerns of clinical practice. NNT answers the question “How many patients would you need to treat with Intervention A instead of Intervention B before you would expect to encounter one additional positive outcome of interest?” Complementing NNT is NNH; NNH answers the question “How many patients would you need to treat with Intervention A instead of Intervention B before you would expect to encounter one additional outcome of interest that you would like to avoid?” As mentioned, there are methods to convert Cohen’s d to NNT,[8] but this conversion is actually more of a “cross-walk” to help with the interpretation of the effect size using the patient-centric language of NNT. Proper NNTs are calculated using proportions, such as the number of patients meeting a pre-defined criterion for treatment response while receiving the intervention in question divided by the total number of patients randomized to the intervention. Having both the numerator and denominator allows the calculation of the 95-percent confidence interval (CI); see reference 10 for the formula. However, in the absence of knowing both the numerator and denominator, one can still calculate the NNT (or NNH) with the percentages usually provided when describing dichotomous outcomes (e.g., response, remission, occurrence of a drug-induced adverse effect, percentage who gained more than 7% of their initial body weight).
“Single-digit” values for NNT (i.e., NNT values <10) usually denote a worthwhile difference when comparing one intervention with another. Although lower NNTs demonstrate a more robust effect size difference, it is common to encounter NNTs of 6 to 9 when comparing psychotropic agents with placebo in the registration studies used by pharmaceutical companies to support regulatory approval.
“Double-digit” or greater values for NNH (i.e., NNH values ?10) are desireable when comparing psychotropic agents with placebo on adverse event outcomes (e.g., rates of akathisia, somnolence/sedation, weight gain ?7% of baseline). These types of NNH calculations can easily be done from information provided in product labelling.[10]
Miracledone and Fantastapine: Clinical Relevance
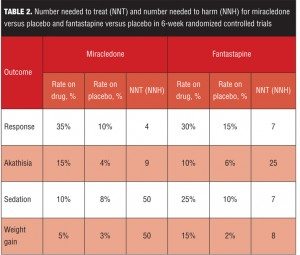
Table 2 lists several clinically relevant NNT and NNH values for our fictional examples of miracledone and fantastapine. Response is defined (somewhat arbitrarily) as a 30-percent decrease from baseline on the PANSS total score. Akathisia and sedation rates are from spontaneously reported adverse events. Weight gain is defined as a change in weight seven percent or more from baseline. For simplicity, the numerators and denominators have been omitted, and thus in this example, the precision of the NNT and NNH estimates are unknown.
Although fantastapine was superior to placebo with a P-value less than 0.001 (Figure 2), miracledone exhibited a more powerful effect size difference from placebo when calculated using both Cohen’s d and NNT for response, despite a P-value of “only” less than 0.05 (Figure 1). However, Cohen’s d values of 0.5 for miracledone and 0.3 for fantastapine are somewhat difficult to place into clinical context. By defining response as an improvement of 30 percent or more from baseline on the PANSS total score, we can determine that it would take four patients to be treated with miracledone instead of placebo in order to encounter one additional responder, but that for fantastapine versus placebo, it would take seven patients to encounter one additional responder. In this indirect comparison, miracledone appears more tangibly efficacious.
However, when deciding among different interventions, tolerability is also important to consider and here the differences between the two fictional agents are striking—miracledone has a “single-digit” NNH value for akathisia and fantastapine has “single-digit” values for sedation and weight gain. Thus, depending on how the individual patient being treated has tolerated similar agents in the past, either miracledone or fantastapine may be appropriate for them.
Thus, the clinical relevance of miracledone and fantastapine can be quantified, aiding the clinician and patient in making the most suitable decision.
Caveats
Up to now, no mention was made regarding relative measures of effect size. A major disadvantage of using a relative measure is that very large treatment effects cannot be discriminated from very small ones [10]. For example, if the rate of an adverse event with a certain medication is one percent and that for another agent is 0.5 percent, it may be stated that the risk of the former agent is twice that of the latter. This does not translate well in day-to-day clinical practice as it would take 200 patients to be treated with the former agent rather than the latter agent in order to encounter one additional instance of the adverse event in question. This may still be important if the outcome being measured is serious but it will nevertheless not be frequently encountered.
It is important to always report the NNT with the rates that were used to calculate it. Knowledge of these rates will help distinguish between a NNT of 10 when it is calculated from rates of 20 percent versus 10 percent as opposed to when it is calculated from rates of 80 percent versus 70 percent—two very different clinical treatment scenarios.[9] Ideally, both the numerator and denominator for each percentage should be provided, and the 95-percent CI calculated and reported as well.
Moreover, the effect of time on benefits such as treatment response can be profound, and the longer the clinical trial, the greater the opportunity for harms such as adverse events to occur or resolve. Thus, the time points when NNT and NNH are calculated need to be noted as well.
Summary
Communicating clinical trial results should include measures of effect size in order to quantify the clinical relevance of the results. P-values are not informative regarding the size of treatment effects. Cohen’s d and its variants are often used but are not easy to understand in terms of applicability to day-to-day clinical practice. NNT and NNH can provide additional information that clinicians may find useful in clinical decision-making, and although limited to dichotomous outcomes, it is recommended that they be considered for inclusion when describing clinical trial results.
This does not eliminate the need to continue carefully crafting randomized controlled trials and statistical analytical plans that employ the very best in modern techniques, nor does it eliminate the need for postmarketing surveillance of community treatment populations to monitor for less common and potentially severe adverse events. However, NNT and NNH have an important place in the toolbox of every clinician who aspires to practice evidence-based medicine by incorporating into his or her acute clinical decision-making efforts to balance acute benefits (efficacy) and common acute nonserious harms (tolerability) based on the available relevant scientific evidence while holding dear the individual patient’s values and preferences.[11]
References
1. Kraemer HC, Kupfer DJ. Size of treatment effects and their importance to clinical research and practice. Biol Psychiatry. 2006;59(11):990–996
2. Citrome L. Compelling or irrelevant? Using number needed to treat can help decide. Acta Psychiatr Scand. 2008;117(6):412–419
3. Citrome L. Relative vs. absolute measures of benefit and risk: What’s the difference? Acta Psychiatr Scand. 2010;121(2):94–102
4. Cohen J. A power primer. Psychol Bull. 1992;112(1):155–159.
5. Ellis PD. Effect Size Matters: How Reporting and Interpreting Effect Sizes Can Improve your Publication Prospects and Change the World! MadMethods, KingsPress.org, 2012.
6. Ellis PD. The Essential Guide to Effect Sizes: Statistical Power, Meta-Analysis, and the Interpretation of Research Results. Cambridge UK:?Cambridge University Press, 2010.
7. Citrome L, Magnusson K. Paging Dr Cohen, Paging Dr Cohen… An effect size interpretation is required STAT!: visualising effect size and an interview with Kristoffer Magnusson. Int J Clin Pract. 2014;68(5):533–534.
8. Furukawa TA, Leucht S. How to obtain NNT from Cohen’s d: comparison of two methods. PLoS One. 2011;6(4):e19070.
9. Citrome L, Ketter TA. When does a difference make a difference? interpretation of number needed to treat, number needed to harm, and likelihood to be helped or harmed. Int J Clin Pract. 2013;67(5):407–411.
10. Citrome L. Quantifying risk: the role of absolute and relative measures in interpreting risk of adverse reactions from product labels of antipsychotic medications. Curr Drug Saf. 2009;4(3):229–237.
11. Citrome L, Ketter TA. Number needed to harm can be clinically useful: a response to Safer and Zito. J Nerv Ment Dis. 2013;201(11):1001–1002.


