 by Jennifer M. Giddens and David V. Sheehan, MD, MBA
J. Giddens is Co-founder of the Tampa Center for Research on Suicidality, Tampa, Florida; and Dr. Sheehan is Distinguished University Health Professor Emeritus, University of South Florida College of Medicine, Tampa, Florida.
Innov Clin Neurosci. 2014;11(9–10):164–171
Funding: There was no funding for the development and writing of this article.
Financial Disclosures: J. Giddens is the author and copyright holder of the Suicide Plan Tracking Scale (SPTS) and is a named consultant on the Sheehan-Suicidality Tracking Scale (S-STS), the Sheehan-Suicidality Tracking Scale Clinically Meaningful Change Measure Version (S-STS CMCM), the Pediatric versions of the S-STS, and the Suicidality Modifiers Scale; Dr. D. Sheehan is the author and copyright holder of the S-STS, the S-STS CMCM, the Pediatric versions of the S-STS, the Sheehan Disability Scale (SDS), and the Suicidality Modifiers Scale, is a co-author of the SPTS, and owns stock in Medical Outcomes Systems, which has computerized the S-STS.
Key Words: Suicide scale, suicide assessment, suicide risk, suicide, suicidality, S-STS, SPTS, time spent, global severity, hopelessness
Abstract: Objectives: This paper investigates the relationship between total scale scores and some other measures used to assess global severity of suicidality in order to determine if “global assessment” can be accomplished with one metric or if is it necessary to judge severity of suicidality in a multidimensional fashion. Methods: For over a year, one subject with daily suicidality self-rated a global severity of suicidality score, the time spent in suicidality over 31,183 events of suicidality, the Sheehan-Suicidality Tracking Scale, Hopelessness Spectrum measure, and the Suicide Plan Tracking Scale. Results: Relying on only one or two metrics to assess global severity of suicidality appears to have significant limitations. As with all single case reports, the findings may not be generalizable to other cases of suicidality. Conclusion: At the middle to high end of the suicidality spectrum, it is necessary to rely on multiple metrics, not just a global severity of suicidality rating, to properly assess the overall severity of suicidality.
Introduction
Multidimensional rating scales are traditionally used to capture the range of symptoms, symptom groupings, signs, and phenomena of a psychiatric disorder. A measure of global severity “has the advantage of being a summary that allows the rater to combine the elements of psychopathology into a single meaningful index of severity of illness.”[1] In many studies, global ratings are reported to be “more sensitive to differential treatment effects than do measures of single dimensions of psychopathology.”[2] Clinicians have relied on a single scale or a single item or a few questions to assess overall suicidal severity. Some use a single dimension global assessment of suicidality severity as a reference anchor against which to judge suicidality scales or other suicidality metrics as if the single dimension global measure of severity is a standard against which all else should be judged. Researchers want to know how the total score on any scale relates to global severity ratings of the same variable set. The expectation is that the relationship will be strong, high, and, hopefully, an ascending linear relationship across the full range of symptoms. However, the relationship between symptom scale scores and global assessments of severity is often complex. This case study investigates the relationship between total scores and other measures sometimes used to assess global severity of suicidality. The findings may assist clinicians and regulators in how best to judge the overall severity of suicidality. Can this be accomplished with one metric or is it necessary to judge global severity of suicidality in a multidimensional fashion? The case study attempts to shed some light on this question.
Methods
A 29-year-old female subject diagnosed with Asperger syndrome who experienced suicidality almost daily for more than 20 years collected detailed daily and weekly data on her events of suicidality. She rated the severity of her suicidality daily using a 0 to 4 global severity scale, where 0=not at all, 1=mild, 2=moderate, 3=severe, and 4=extreme. Suicidality was defined as the suicidal phenomena captured by page 1 of the 11/11/11 version of the Sheehan-Suicidality Tracking Scale (S-STS),[3] with the exception of non-suicidal self-injury. Suicidality is broader than the term suicidal ideation and behavior. It encompasses suicidal impulses, which can occur before and apart from suicidal ideation, and includes other suicidal phenomena such as suicidal dreams and psychotic command hallucinations to take suicidal actions. The term global suicidality embraces all of these phenomena in one global score. The subject captured these daily scores every morning for the prior day (12:00 AM through 11:59 PM) in a spreadsheet.
The subject completed the computerized version of the 11/11/11 version of the S-STS each week.[4] The S-STS is a two-page scale with 11 questions about suicidal phenomena and one question on non-suicidal self-injury that uses a 0 to 4 (5-point) Likert scale with descriptive anchors (0=not at all, 1=a little, 2=moderately, 3=very, 4=extremely). She completed the Suicide Plan Tracking Scale (SPTS) each week. The SPTS is a 20-question scale about suicidal planning that uses a 0 to 4 (5-point) Likert scale with two sets of descriptive anchors. Seventeen questions use 0=not at all, 1=a little, 2=partially, 3=mostly, and 4=totally as descriptive anchors; two questions use 0=none, 1=a little, 2=partial, 3=a lot, and 4=complete as descriptive anchors; and one question has a no/yes response option. The subject also completed the Alphs Dichotomous Hopeful/Hopelessness Question (Hopelessness Spectrum) (used in the University of Alabama Birmingham InterSePT Scale for Suicidal Thinking [ISST-Plus] Validation Study[5]) each week. The Hopelessness Spectrum descriptive anchors were “extremely hopeful,” “very hopeful,” “moderately hopeful,” “in the middle,” “moderately hopeless,” “very hopeless,” and “extremely hopeless.” The subject completed this weekly tracking on Mondays for the prior week (Monday at midnight to Sunday night at 11:59:59 PM).
The subject concurrently documented her global severity of suicidality events for the prior day every morning over 65 weeks and the time spent daily in suicidality for 56 of these weeks. During the 65 weeks, she documented 31,183 separate suicidality events.
We summed the daily 0 to 4 global severity scores for each week of tracking. The total S-STS score was calculated by summing the scores to answers 1 through 8 and 10. Question 9 (non-suicidal self-injury) was not counted as a suicidal phenomenon and was excluded from the total S-STS score calculation. The most recent version of the S-STS (1/4/14) does not include the non-suicidal self-injury item in the calculation of the total S-STS score, consistent with the way the total S-STS score is calculated in this paper. The SPTS score was calculated by summing the scores to answers 1 through 19. The answers to the Hopelessness Spectrum were converted to numeric values with 1=extremely hopeful, 2=very hopeful, 3=moderately hopeful, 4=in the middle, 5=moderately hopeless, 6=very hopeless, and 7=extremely hopeless. The daily number of minutes the subject experienced suicidality each week were summed.
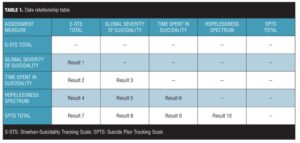
Table 1 illustrates the way this case study reports the relationship of the variables to each other. The result number listed in the table indicates which section of the paper discusses each of these relationships.
Data for the S-STS total, the global severity of suicidality, the Hopelessness Spectrum, and the SPTS total were collected for 16 months, but data for the daily time spent experiencing suicidality were only collected for the last 13 months (56 weeks) of that 16-month (65 weeks) period. All available data were used in the analysis for this paper.
Results
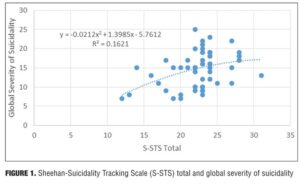
Result 1: S-STS total and global severity of suicidality. Figure 1 illustrates the relationship between the S-STS total score and the global severity of suicidality. There is an ascending relationship between the S-STS total and global severity of suicidality. A polynomial regression trendline is the best fit to the dataset: Figure 1 shows an order 2 trendline.
Discussion. As the S-STS total score increased, the global severity score decreased at the top end. The subject interpreted this to mean that when the S-STS scores where high, she somewhat minimized the overall global severity of suicidality. She believes she did this in order to help her cope with the severity of her symptoms. She stated that it was easier to admit to the severity of one item on the S-STS (even if this occurred multiple times and the item scores were then summed, as in the S-STS) than it was to admit to the gravity of the overall global severity of suicidality.
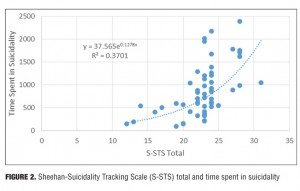
Result 2: S-STS total and time spent in suicidality. Figure 2 illustrates the relationship between the S-STS total score and the time spent in suicidality. There is an ascending relationship between the S-STS total and time spent in suicidality. An exponential regression trendline is the best fit to the dataset.
Discussion. At the high end of the S-STS total score, there was exponentially more time spent in suicidality. The subject stated that at higher S-STS total scores, she had often completed her suicidal planning ideation and had moved on to engaging in preparatory behaviors. These preparatory behaviors took more time than the planning ideation.
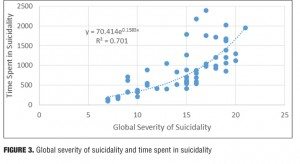
Result 3: Global severity of suicidality and time spent in suicidality. Figure 3 illustrates the relationship between the global severity of suicidality and the time spent in suicidality. There is an ascending relationship between the global severity of suicidality and time spent in suicidality. A power regression trendline is the best fit to the dataset.
Discussion. At the top end of the global severity of suicidality, there was disproportionally greater amount of time spent in suicidality. The subject believes that the main driver of the global severity at the lower end of the trendline was the time spent in suicidality. However, toward the middle and the top end of the trendline, the driver may flip-flop between both the time spent and the global severity. The subject noted that when her symptoms were more severe there was an increase in time spent, which increased the global severity. These increases compounded each other leading to a deteriorating spiral, until it was difficult to determine which one was the primary driver.
In a 0 to 4 global severity scale, when the score exceeds 2, the time spent appears to be a more sensitive measure of global severity than the global severity rating itself. Time spent in suicidality is a very sensitive signal of severity of suicidality, especially at the upper end of suicidality severity.
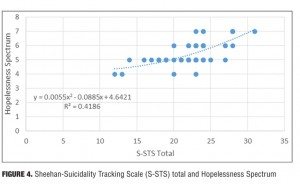
Result 4: S-STS total and Hopelessness Spectrum. Figure 4 illustrates the relationship between the S-STS total score and the Hopelessness Spectrum. There is an ascending relationship between the S-STS total and the Hopelessness Spectrum. A polynomial regression trendline is the best fit to the dataset: Figure 4 shows an order 2 trendline.
Discussion. At the high end of the S-STS total score, the hopelessness score became disproportionately higher. The subject noted that when her S-STS total score was higher (i.e., when she was actively planning a suicide attempt), it tended to be at times when her hopelessness was more extreme.
The S-STS score might reach a plateau where it cannot get any higher until the patient makes an attempt. The subject noted that this might explain why the hopelessness score became disproportionately higher than the S-STS score. She stated that she tended not to begin engaging in preparatory behaviors and/or willful suicidal planning unless her hopelessness was extreme. Twenty-eight points is the highest possible score the subject can get on the S-STS without engaging in a preparatory behavior or making an attempt. This score is reduced by 4 if the patient did not have an accident in the time frame. Thus, 24 points is about as high of a score as possible without the subject engaging in suicidal behaviors. Twenty-four points on the S-STS is approximately the location in the trendline where the hopelessness score became disproportionately higher.
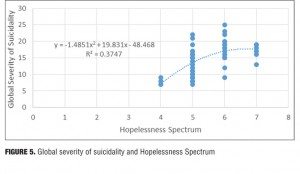
Result 5: Global severity of suicidality and Hopelessness Spectrum. Figure 5 illustrates the relationship between the global severity of suicidality and the Hopelessness Spectrum. There is an ascending relationship between the global severity of suicidality and the Hopelessness Spectrum. A polynomial regression trendline is the best fit to the dataset: Figure 5 shows an order 2 trendline.
Discussion. At more severe levels of hopelessness (at a score of 6 or higher), the global severity of suicidality decreased disproportionately. The subject noted that this may relate to the way these two data values were captured. The global severity of suicidality score was rated daily and then summed for the week while the hopelessness rating was only captured once weekly. The subject stated that it was easier for her to be completely honest once on the hopelessness rating than it was for her to be honest seven times in the week on the global severity of suicidality rating. It is also likely the subject minimized her global severity score because “it was more difficult to admit to overall suicidality being more severe than it was to admit that the hopelessness was more severe.”
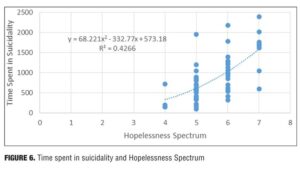
Result 6: Time spent in suicidality and Hopelessness Spectrum. Figure 6 illustrates the relationship between the time spent in suicidality and the Hopelessness Spectrum. There is an ascending relationship between the time spent in suicidality and the Hopelessness Spectrum. A polynomial regression trendline is the best fit to the dataset: Figure 6 shows an order 2 trendline.
Discussion. At the upper end of the trendline, as the subject felt more hopeless, she spent disproportionately more time in suicidality. At the highest levels of hopelessness, she often made a decision to attempt suicide. She had learned from experience that when she decided to make an attempt it was followed by a reduction in the suicidal ideation that she could not control in any way other than by deciding to make an attempt. The decision to make an attempt required that she spend much more time in planning ideation and in preparatory behaviors than she had spent experiencing the suicidal ideation that she could not otherwise control. This resulted in an increase in the time spent in suicidality.
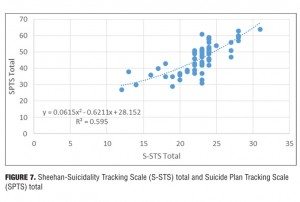
Result 7: S-STS total and SPTS total. Figure 7 illustrates the relationship between the S-STS total score and the SPTS total score. There is an ascending relationship between the S-STS total score and the SPTS total score. A polynomial regression trendline is the best fit to the dataset: Figure 7 shows an order 2 trendline.
Discussion. The S-STS score does not go up in a linear relationship with the SPTS score. At the high end of S-STS scores, the subject has to engage in suicidal behaviors for the S-STS score to increase. The S-STS asks fewer details about suicidal planning than the SPTS, hence the disproportionately higher SPTS scores at the upper end of the trendline. When the score on the S-STS exceeds 23, clinicians need to get more of the explicit details about the suicidal planning.
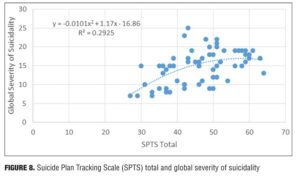
Result 8: SPTS total and global severity of suicidality. Figure 8 illustrates the relationship between the SPTS total score and the global severity of suicidality. There is an ascending relationship between the SPTS total score and the global severity of suicidality. A polynomial regression trendline is the best fit to the dataset: Figure 8 shows an order 2 trendline.
Discussion. At a higher global severity of suicidality, there was a disproportionately lower SPTS total score. This may be due the fact that the SPTS only focuses on the suicidal planning and does not, to the same degree, measure the suicidal behaviors at the upper end.
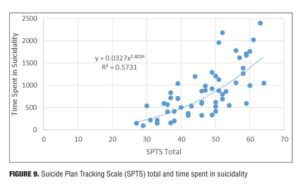
Result 9: SPTS total and time spent in suicidality. Figure 9 illustrates the relationship between the SPTS total score and the time spent in suicidality. There is an ascending relationship between the SPTS total score and the time spent in suicidality. A power regression trendline is the best fit to the dataset.
Discussion. At the high end of the SPTS total scores, there was disproportionately greater time spent in overall suicidality. The higher time spent at the upper end of the trendline was likely due to the suicidal planning moving into suicidal preparatory behaviors. Suicidal preparatory behaviors lasted a disproportionately longer period of time compared to suicidal planning.
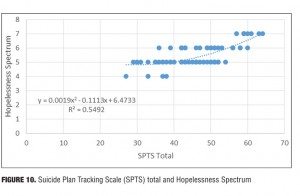
Result 10: SPTS total and Hopelessness Spectrum. Figure 10 illustrates the relationship between the SPTS total score and the Hopelessness Spectrum. There is an ascending relationship between the SPTS total score and the Hopelessness Spectrum. A polynomial regression trendline is the best fit to the dataset: Figure 10 shows an order 2 trendline.
Discussion. At the high end of the hopelessness score, there was a disproportionately lower score on the SPTS total. When the hopelessness was very high, the patient engaged in more preparatory behaviors, which resulted in less suicidal planning (and, hence, the disproportionately lower SPTS scores).
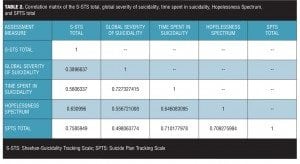
Result 11: Correlation matrix. Table 2 shows a correlation matrix between all of the variables discussed in this case study.
Discussion. There were strong correlations among most of the variables examined in this case study. The weaker relationship between the global severity of suicidality and both the S-STS total score and the SPTS total score may relate to the daily collection of the global severity ratings and ratings that were summed for the week, while the scale scores were collected weekly using a look-back over the week. Another reason may relate to a tendency for the subject to minimize the global severity of suicidality ratings compared to her perception that she more accurately reported the item scores on each of these two scales when the rating was done weekly.
The otherwise strong correlations make clinical sense in the light of the interpretations reported for Results 1 through 10 above.
Discussion
Relying on only one or two metrics to assess global severity of suicidality appears to have significant limitations. Patients with suicidality and experienced clinicians instinctively understand this. The subject of this report succinctly summarized this issue and its implications to us when she stated “if a clinician believes they can assess my suicidality based only on one question (which actually happened to me), as in a global severity of suicidality rating, then it is clear to me that they do not understand suicidality well enough to properly treat me. I interpret a clinician’s use of one question to assess my suicidality to mean it’s a waste of my time to be honest with them and end up being admitted to the hospital under their care.” Clinicians may find that they are better able to engage their suicidal patients in an empathic therapeutic relationship if they take the time to conduct their assessments of suicidality using a multidimensional approach.
Limitations. The limitations of this study are that it is based on a single case, the case may be an outlier, and the findings may not be generalizable to other cases of suicidality. Another possible limitation is that the global severity ratings were collected daily and summed for the week, while the other variables were collected weekly. The subject’s personal understanding of suicidality and its severity is likely normalized using herself as a reference. This could limit the meaningfulness of the findings. On the S-STS (11/11/11 version used), the suicidality score can range from 0 to 44. Over the 65-week period of this case study, the subject’s S-STS score ranged from 12 to 31 (maximum possible is 44), from 27 to 64 on the SPTS (maximum possible is 76), and from 7 to 25 on the global severity of suicidality scale (maximum possible is 28), which covers a wide range of severity. A single case study covering the phenomena of suicidality across 31,183 suicidal events tracked over 65 weeks may have some advantages over data collected in a larger series by providing more consistency of ratings than seen in a larger heterogeneous sample and a wider spectrum of score severity than usually found within most single subjects. The findings need to be investigated in larger samples with more diversity of comorbid diagnoses and more ethnic and religious diversity.
Conclusion
At the middle to high end of the suicidality spectrum, it may be prudent not to rely on one suicidality variable to gauge the true global severity of suicidality. Using multiple variables and taking the time spent in suicidality into consideration may be a more prudent approach. For example, in spite of the fact that the total scores of the standard version of the S-STS and the SPTS capture a wide spectrum of information about suicidality, neither one of these is sufficient in itself at the upper end of the spectrum to give the clinician a comprehensive picture of a patient’s suicidality. When suicidality is very severe, there is a tendency for some patients to minimize the global severity of their suicidality when it is rated on a single dimension.
In our case study, when the severity of suicidality reached a midpoint or higher, the hopelessness became an important aggravating factor in further worsening the suicidality. Hopelessness can be the factor that drives the suicidality further out of control.
The findings invite debate and discussion on whether the use of multidimensional scaling is a more reliable approach in assessing overall severity of suicidality than using a single dimension of global severity. Suicidality may be more complex than other psychiatric disorders in that it may be so laden with stigma, fear, medico-legal implications, concerns about the need for hospitalization, and very dangerous outcomes that these issues may enter into and contaminate clinician and patient ratings of a single dimensional global severity measure. The subject’s interpretations of the findings appear to support the presence of such unspoken influences. This may make global assessment of suicidality on a single dimension more complex than in other psychiatric disorders. The assumptions that guide a scientific concept like “global rating of severity” are often buried and not exposed to adequate scrutiny. This case study attempted to uncover and investigate what Agger calls the “blind spots, omissions, tensions and contradictions […and] internal fissures and fault lines” in assessing global severity of suicidality using a single global dimension.[6]
References
1. Endicott J, Spitzer RL, Fleiss JL et al. The Global Assessment Scale. Arch Gen Psychiatry. 1976;33:766–771.
2. McGlashan T (ed). The Documentation of Clinical Psychotropic Drug Trials. Rockville, MD: National Institute of Health; 1973.
3. Sheehan DV, Giddens JG, Sheehan IS. Status Update on the Sheehan Suicidality Tracking Scale (S-STS) 2014. Innov Clin Neurosci. 2014;11(9–10):93–140.
4. Dolphin Electronic Data Capture (eMINI Professional Version 2.1.1/R131112.1 Database Version 2.26) [Software]. (1994–2012). http://medical-outcomes.com/.
5. Alphs L. Two dichotomized spectrum test questions (one assessing a impulsivity—caution dichotomous spectrum—the second using a hopefulness—hopelessness dichotomous spectrum) developed by L Alphs for the study reported in “Comparative Validation of the ISST-Plus, the S-STS and the C-SSRS for assessing suicidal thinking and behavior.” Poster presented at the 14th International Congress on Schizophrenia Research (ICOSR), April 21–25, 2013, Orlando, FL, USA. (L Alphs, personal communication).
6. Agger B. Cultural Studies as Critical Theory. London, UK: The Falmer Press; 1982:102.


