

by Franco Di Cesare, MD; Cristiana Di Carlo, MSc; and Leonardo Di Cesare, MD
Drs. F. Di Cesare and Di Carlo are with Leoben Research srl in Rome, Italy. Dr. L. Di Cesare is with Glaxo-Smith-Kline in Siena, Italy.
Funding: The project was sponsored and funded by Leoben Research.
Disclosures: Drs. F. Di Cesare and Di Carlo are co-founders and co-owners of Leoben Research. Dr. L. Di Cesare was previously employed by Leoben Research.
Innov Clin Neurosci. 2023;20(1–3):39–45.
Abstract
Objective: The paucity of valid diagnostic tools is one of the challenges preventing the effective implementation of child cognitive health testing in Sub-Saharan developing countries. WAVES addresses the need for new psychometric tests to evaluate visuospatial construction ability in a school-aged population. WAVES involves the standardized administration of a copy design task that is sequentially repeated by four distinct reproduction modalities: copy design with open eyes (CDO), immediate reproduction from memory with open eyes (IRMO), immediate reproduction from memory with closed eyes (IRMC), and delayed reproduction from memory with closed eyes (DRMC).
Design: WAVES reliability and validity were assessed in a field trial using Classical Test Theory or Item Response Theory (IRT) methods. A total of 445 children, aged 5 to 17 years old, were recruited at multiple Zambian clinical sites and schools.
Results: WAVES provides a visuographomotor construction processing (VGCP) index and three subscale inaccuracy of reproduction scores: perseveration, decreased spacing, and changing direction difficulty (CDD). WAVES scores depended on age and showed an age-related increase of reproduction accuracy. Altered visuospatial construction, as indicated by higher scores, was associated with poor health status (i.e., chronic neurologic or medical disease or prolonged exposure to psychosocial stress and deprivation). Reliability estimates, expressed as an intraclass correlation coefficient (ICC; 95% confidence interval [CI]), at test-retest (n=86) were: VGCP Index: 0.94 (0.91, 0.96); perseveration: 0.76 (0.62, 0.84); decreased spacing: 0.86 (0.79, 0.91); and CDD: 0.93 (0.89, 0.95).
Conclusion: WAVES has potential for clinical utility in evaluating the effect of different health conditions on visuospatial construction ability. Study results warrant further research to validate its use in healthcare and clinical research settings.
Keywords: Clinical trials, pediatric cognitive assessment, visuospatial construction, visual imagery, test development, developing countries
In developing countries of the Sub-Saharan region, the paucity of valid diagnostic tools is one of the barriers preventing an efficient assessment of cognitive health outcomes at individual point-of-healthcare, group, large community, or country population levels.1,2 Zambia is an illustrative example of a developing country meeting the challenge of enabling efficient pediatric cognitive assessments. Zambia mostly relies on a handful of diagnostic instruments that are developed in North American and European countries, then imported to Zambia.3–7 Zambia shares the issue of over-reliance on imported instruments and the challenge of producing original tests with many other developing countries worldwide. Importantly, the adoption of tests developed and standardized in a distinct cultural and socioeconomic context carries the risk of poor cross-cultural validity, misrepresenting the cognitive abilities of children.8 A strategy for developing cognitive tests for use in Sub-Saharan countries should be based on the original design of a culturally appropriate tool and its validation in the specific context of use.8–11
Visuospatial construction is a domain of cognitive functioning that underlies any type of formulative behavior in which parts are organized to form a single object (e.g., assembling blocks to form a design or drawing).12 It can be defined as the ability to see an object or picture as a set of parts and then to construct a replica of the original from these parts.13 Visuospatial construction requires that the spatial relations among the component parts be accurately perceived if these parts are to be integrated into the desired unitary object representation.13
As cognitive impairments have the potential to deter a child’s psychological development and pose a threat to the full functioning in life, early detection and precise determination of visuospatial construction impairment can identify children at increased risk for altered psychological development and provide information to determine the most appropriate clinical management measures to adopt.
To the best of our knowledge, no cognitive test originally designed to evaluate visuospatial construction in Zambian school-aged children is currently available. We report the development of WAVES, a new test to measure visuospatial construction.
Materials and Methods
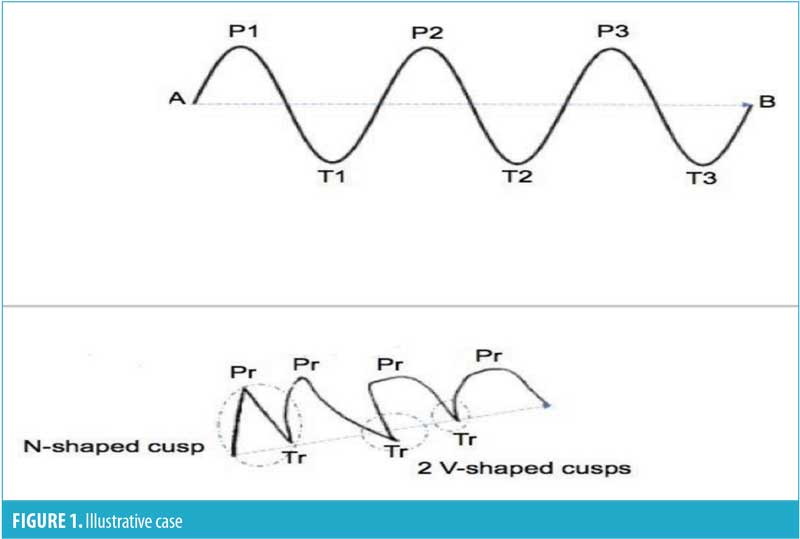
Instrument. WAVES is based on the standardized administration of a copy design task sequentially repeated by four different reproduction modalities. The basic drawing task involves showing the child a picture for study and free-hand reproduction using their dominant hand. The picture contains a visual pattern consisting of a centered, black, periodic waveform displayed on a 4.8cm x 21.0cm white background (Figure 1).
The periodic waveform presents three sequential repetitions of cycles, each of them with a peak- and through-point, as well as two points of flexus, over a 14.4cm axis. The examiner asks the child to study the visual pattern and reproduce the picture by drawing it as close to the original as possible onto the prespecified area of the data capture sheet. The study time allowed for each reproduction is three seconds; there is no time limit for completing a reproduction. The task involves drawing a continuous line in a succession of six bell-shaped curves, changing trail direction at peak- or trough-points and at flexus-points, and maintaining spacing of the reproduction over a 14.4cm axis. There is a standardized sequence of modalities of reproduction, which includes copying design with open eyes (CDO), immediate reproduction from memory with open eyes (IRMO), immediate reproduction from memory with closed eyes (IRMC), and delayed reproduction from memory with closed eyes (DRMC), after 3 to 5 seconds of interference. In the end, the procedure generates a WAVES gallery of four reproductions.
The examiner evaluates each reproduction by visual inspection and metric assessment according to predefined scoring criteria. Reproduction inaccuracies (errors) are identified and scored. There are three error types: changing direction difficulty (CDD), decreased spacing, and perseveration (Figure 1). CDD is an error in changing trail direction during reproduction at peak- and trough-points or flexus-points. The presence of V- or N-shaped cusps indicates CDD (Figure 1). Perseveration is the tendency of continuing to trail a curvilinear line beyond the limits called for by the stimulus waveform. A perseveration error is scored as a sum of peaks and troughs higher than eight in the reproduction. Decreased spacing is the tendency to decrease the spatial size of the reproduction in comparison to the stimulus waveform. A decreased spacing error occurs with a distance between the two farthest points that is lower than 66 percent in the reproduction (Figure 1), compared to stimulus waveform. The presence of an error type in the reproduction is scored as 1, its absence as 0. A WAVES gallery generates set of 12-item 0 to 1 raw scores.
Design. A cross-sectional field trial combined with an ancillary test-retest reliability study on a selected subgroup of participants was executed.
Ethical considerations. We carried out the trial in accordance with Zambian legal and regulatory requirements. The study obtained approval from the National Health Research Authority and the University of Zambia Biomedical Research Ethics Committee (reference number 008-08-165, approval on February 27, 2018). Parents or legal guardians of children participating in this study signed a written, informed consent, including assent from the child if aged 12 years or older. The informed consent process was conducted in the presence of an independent witness for illiterate parents or guardians.
Participants. Children aged 5 to 17 years (including limits), with access to formal education and experience and familiarity with cognitive tasks similar to the one required by the WAVES (i.e., drawing), who were able to communicate effectively with the examiner, and with a signed, informed consent from parents or legal guardians were eligible for participation.
Exclusion criteria included presence of a serious health condition currently requiring inpatient hospitalization, significant visuoperceptual disabilities not corrected by glasses or lenses, significant speech disability, hearing impairments, significant sensory or motor disabilities, current acute medical or mental health condition, any significant chronic conditions preventing cognitive testing, inability to understand test instructions, or being uncooperative during the execution of assessments.
Study participants and sites for test administration represented a broad sample of children and settings intended for the utilization of WAVES. The study population was recruited from multiple clinical and school sites in two diverse regions of Zambia, Lusaka Metropolitan Area and the Copperbelt Province. Schools were purposely selected to provide a heterogeneous sample representative of the wide socioeconomic, cultural, and linguistic diversity of the pediatric population across regions. Clinical sites were also selected to ensure that a heterogeneous sample, representative of the diversity of medical and psychosocial conditions affecting child health and cognitive development, was drawn. The clinical sites included in this study were the outpatient clinics at the University Teaching Hospital Department of Pediatrics and Child Health in Lusaka and tertiary outpatient clinics in the Copperbelt Province, Ndola area. University Teaching Hospital is the highest referral hospital in Zambia, delivering specialized care in pediatrics, and receives children from all over the country. Study enrollment started in August 2018 and ended in October 2019.
Data collection methods and analysis. Sociodemographic and medical history information were collected, and WAVES was administered to all study participants. A subsample of participants underwent clinical and neurological examinations and electroencephalographic evaluation.
STATA software version 15.114 was used for statistical analyses. WAVES reliability, measurement invariance, and validity were assessed based on data extracted from the field trial clinical database using Classical Test Theory and Item Response Theory (IRT) methods and techniques.
Results
Sample characteristics are shown in Table 1. The sample included children in apparent good health at the time of assessment, though they may have had a chronic health condition that did not represent an important risk or causative factor for cognitive impairment, who had access to formal education, and regularly attended school. A total of 97.4 percent of participants lived in an urban area.
Item calibration. An initial multistep analysis aimed at defining basic psychometric properties of the 12 items and providing information on the most pertinent set of items to be retained.
First, an IRT two-parameter logistic model was found to be the best fit of data, compared to one- and three-parameter models. Summary results are reported in Table 2.
Second, an item characteristic curve for each item was plotted and examined. An item characteristic curve describes the probability of success of a person on a given item, wherein the probability of success is a function of both the level of ability and item properties (i.e., difficulty and discrimination). The value level of the ability for a given person is defined as the person location and is denoted by θ. We found that the 12 items covered a wide range of the item difficulty spectrum, with a value of 0.8 at the lowest and a value of 2.2 at the highest (Table 2). Item discrimination estimates, ranging between 1.2 and 4.0 (Table 2), suggested that items were discriminating; that is, in the vicinity of a given difficulty estimate, any two children with distinct visuospatial construction ability would have different predicted probabilities of successfully responding to an item.
Third, the item information function (IIF), which is defined as the maximum amount of information an item provides at its estimated difficulty parameter for estimating the ability, was calculated for each item. We found all items to be discriminating. CDD error items were most discriminating and had the steepest IIFs.
Fourth, a test information function (TIF), obtained by adding IIF values, was used to obtain precise estimates of a person’s ability level at specified intervals. The TIF plot indicated how precisely the instrument could estimate person locations. The set of 12 items provided maximum information for persons located in the range of θ values between 0.5 and 1.0. As one moved away from that point in either direction, the standard error of the TIF increased, and the instrument provided less and less information about θ. The TIF curve was steep, indicating that the set of items was more precise at the extrema of the ability range. As we intend to primarily identify children with mild-to-moderate impairment, this metric characteristic fits the purpose of the instrument.
Finally, we constructed a test characteristic curve plotting the expected scores against the ability and found that these expected scores corresponded with the ability locations at 0.05 and 8.54 for values of θ equal to -1.96 and 1.96, respectively. Higher scores reflected a higher level of inaccuracy of reproduction, meaning higher visuospatial construction impairment.
Differential item functioning (DIF). As a prerequisite for subsequent comparisons of WAVES scores across sex and health status groups, an initial assessment of item measurement noninvariance was completed. Whether an item exhibited DIF between two observed groups was evaluated using Mantel-Haenszel statistics.
In relation to uniform DIF based on sex group, the analysis showed that three of 12 items favored the male group relative to the female group for all values of the ability: perseveration IRMO (odds ratio [OR]: 1.89, Chi-squared: 3.86, p=0.049), perseveration IRMC (OR: 1.86, Chi-squared: 4.30, p=0.038), and perseveration DRMC (OR: 1.90, Chi-squared: 4.23, p=0.040). In relation to uniform DIF based on health status, the item perseveration IMRC favored the poor health group relative to the healthy group (OR: 2.20, Chi-squared: 5.99, p=0.0144).
Measurement model. WAVES is intended to assess a specific visuospatial construction ability underlying the reproduction of a visual image by graphomotor activity, which we defined as visuographomotor construction processing (VGCP). We assumed that differences within the construct of VGCP were due to a set of different and complementary subabilities, and the test score should reflect those underlying subabilities. A bifactor measurement model was deemed appropriate for the analysis of WAVES data. The bifactor model assumes each item loads onto two dimensions (i.e., items of the VGCP construct can be associated with more than one source of true score variance). The first is a general latent factor (VGCP) that underlies all the scale items, and the second is a group factor relating to the three visuographomotor construction subscales. The bifactor model was applied to estimate a unidimensional construct while maintaining the multidimensionality of the VGCP construct. This approach examined any distortion that might have occurred when unidimensional models were fit to multidimensional data.
Item reduction and test factor structure. Structural equation modeling was applied to validate the WAVES dimensional structure. Exploratory binary factor analyses were carried out to inform on relationships between items and factors, as well as on item and test structure dimensionality. Confirmatory factor analyses (CFA) were performed for the systematic comparison of an alternative a priori factor structure based on systematic fit assessment procedures.
Initially, interitem tetrachoric correlations for binary items were assessed, with most of the item variables being correlated at a strong level (r≥0.60). Assumptions of independent sampling, normality, linear relationship between pairs of variables, and the variable being correlated that were at a moderate level (r≥0.30) were checked to verify the validity of the application of factor analysis. Exploratory factor analysis was carried out in 445 cases, and the ratio of observed cases to number of items was 37.0. The Kaiser-Olgin-Maier measure of sample adequacy (KOM-MSA) was 0.81, with a cut-off of KOM-MSA greater than 0.70 for sample adequacy.15 A principal component analysis was the chosen method of factor extraction. Factors with eigenvalues greater than one were considered significant; the inspection of scree plot of eigenvalues was also conducted to evaluate the number of factors. VARIMAX orthogonal factor rotation method with Kaiser’s normalization was applied. Items with factor loadings lower than 0.40 were assessed as of no practical significance.16 A three-factor solution explaining the 65.1 percent of total variance emerged. Factor 1, with an eigenvalue of 2.76, was extracted from the analysis, explaining the 23 percent of total variance; all four CDD items (i.e., CDD CDO, CDD IRMO, CDD IRMC, CDD DRMC) showed high loading values on Factor 1 (“CDD”), ranging from 0.78 to 0.81. Factor 2 (“Decreased Spacing”), with an eigenvalue of 2.63, explaining the 21.94 percent of total variance, presented all four decreased spacing items with high loading values, ranging from 0.72 to 0.84. Factor 3, with an eigenvalue of 2.42, explaining the 20.17 percent of total variance, included all four perseveration items with high loading values, ranging from 0.72 to 0.78. These results indicate a three-factor orthogonal structure, with items posited as unidimensional (i.e., each item measures only one construct), which fit the set of observed data.
We also assessed a model in which items were assumed to be non-unidimensional by using an OBLIMIN oblique factor rotation method. A three-factor solution explaining the 77.2 percent of total variance emerged. Factor 1, with an eigenvalue of 3.47, was extracted from the analysis, explaining the 28.94% of total variance; all four CDD items showed high loading values on Factor 1, ranging from 0.80 to 0.85. Factor 2, with an eigenvalue of 2.93, explaining the 24.44 percent of total variance, presented all four decreased spacing items with high loading values, ranging from 0.72 to 0.86. Factor 3, with an eigenvalue of 2.86, explaining the 23.82 percent of total variance, included all four perseveration items with high loading values, ranging from 0.74 to 0.79. These results suggest that a three-factor structure in which factors are correlated, rather than orthogonal, better explained the set of observed data.
CFA. We further explored the measurement model, comparing the fit of two models, a three-factor, correlated CFA model and a bifactor CFA model, to the one general and three specific factors combined. As the data did not meet the assumption of normality, we selected maximum likelihood with robust standard (MLR) errors as our model estimator in accordance with recommendations for modeling data of this type. Model fit statistics are reported in Table 3.
The bifactor model showed an acceptable fit to the observed data and was adequate to represent the dimensionality of the VGCP construct.
Scale item scoring. Upon satisfactory assessments of reliability, measurement noninvariance, factor validity, and test dimensionality, four scores for each study participant were calculated by using unweighted procedures involving summing raw item scores, as follows:
- Perseveration: sum of perseveration CDO+perseveration IRMO+perseveration IRMC+perseveration DRMC.
- Decreased spacing: sum of decreased spacing CDO+decreased spacing IRMO+decreased spacing IRMC+decreased spacing DRMC
- CDD: sum of CDD CDO+CDD IRMO+CDD IRMC+CDD DRMC
- VGCP index (VGCP-I): sum of the 12 item scores.
Higher scale scores indicate higher inaccuracy of reproduction.
Scale scores reliability. For each scale, Cronbach’s α was calculated as a point estimate of internal consistency. We applied a cut-off value of α greater than 0.80 to determine the threshold for acceptability of reliability estimates for the intended clinical use of the instrument.17 Cronbach’s α were as follows: VGCP-I: 0.82, perseveration: 0.79, CDD: 0.85, and decreased spacing: 0.81.
Table 4 shows the results of the test-retest evaluation. Reliability estimates ranged from good to excellent across WAVES scores and were adequate for a clinical use.18
Validity of test scores. Nonparametric and parametric tests, correlations, and linear regression methods were applied to evaluate the effects of sex, age, and health status on WAVES scores.
Effect of sex. In healthy participants, VGCP-I mean score for the male group (n=154, mean: 1.83, standard deviation [SD]: 2.5) was higher than the female group (n=186, mean: 1.48, SD: 2.1). The difference was not statistically significant (defined as p<0.05) between the two groups [t (1, 338): -1.41, p=0.0795].
Perseveration mean score for the male group (n=154, mean: 0.81, SD: 1.2) was higher than the female group (n=186, mean: 0.42, SD: 0.9); the difference was significant [t (1, 338): -3.31, p=0.0005]. Decreased spacing [t (1, 338): -0.88, p=0.189] and CDD [t (1, 338): 0.753, p=0.7743] were not significantly different.
Effect of age. In healthy participants, VGCP-I (r= -0.51, p=0.000), perseveration (r= -0.43, p=0.000), decreased spacing (r= -0.23, p=0.000), and CDD (r= -0.40, p=0.000) were associated with age, with a small-to-moderate strength of correlation.
Effect of age on WAVES scores was also evaluated by comparing childhood (ages 5–7 years, n=78), late childhood (ages 8–11 years, n=99), and adolescence (ages 12–17 years, n=163) age groups (Table 5). One-way ANOVA showed a significant effect on VGCP-I [F (2, 337): 62.07, p=0.000], perseveration [F (2, 337): 42.24, p=0.000], CDD [F (2, 337): 34.36, p=0.000], and decreased spacing [F (2, 337): 11.34, p=0.000].
Findings show that inaccuracy of reproduction, as measured by WAVES scores, was dependent by age group and decreased with age, suggesting that visuospatial construction ability develops with age.
Effect of health status. We evaluated effect of health status on WAVES scores by comparing two groups of participants, those with poor health versus healthy controls. Sample characteristics are summarized in Table 1. The poor health group included children with at least one chronic health condition that was a recognized important risk or causative factor for cognitive impairment and requiring therapeutic intervention at the time of study assessment. The diagnostic classification was based on a medical review of the child’s available health information, as made available by medical history, clinical and neurological examinations, instrumental diagnosis, or reporting from reliable proxies.
The healthy group showed more favorable indicators of social functioning, such as the ability to speak multiple languages (i.e., more than one Zambian language, such as Bemba and Nyanja in Lusaka area, and English at school). Delayed access to school was less frequent in the healthy group. The two groups were comparable by age.
Children with poor health status showed higher inaccuracy of reproduction across all WAVES scores, with effect size ranging from small for CDD and decreased spacing to moderate for perseveration and VGCP-I (Table 6).
Notably, male participants were more frequently represented in the poor health status group. A three-way unrelated ANOVA between subjects-effects model showed effect of sex on all WAVES measures was not significant, except for perseveration. Effect of health status [F (1, 444): 14.62, p=0.0002], age in months [F (133, 444): 1.84, p=0.0000], and sex [F (1, 444): 12.05, p=0.0006] on perseveration were statistically significant. The effect size of perseveration could be influenced by sex and slightly inflated due to the presence of a larger portions of male participants, who were more likely to have a worse performance when compared to matching female participants, in the poor health group.
Discussion
WAVES is a paper-and-pencil cognitive test characterized by a user-friendly, simplified, fast (test completed within 5 minutes), and streamlined procedure of administration and scoring. It is intended for use in healthcare and clinical research settings to evaluate visuospatial construction over time and detect impairment.
WAVES provides measures of visuospatial construction with the VGCP-I and three subscale inaccuracy scores (CDD, decreased spacing, and perseveration). WAVES provides information on the efficiency of complex visuoperceptual, imagery, and graphomotor response abilities, underlying an accurate reproduction of a regular visual pattern (i.e., sine waveform), under distinct visually and nonvisually guided modalities of reproduction.
WAVES measures showed satisfactory psychometric properties in a sample of the Zambian school-aged population. Its stability over time was successfully demonstrated, and reliability estimates at test-retest were adequate for clinical use. WAVES has a good reliability when the purpose of the measurement is to provide an assessment of cognitive status.
Study results demonstrate the potential utility of WAVES in evaluating the effect of health-related risks or protective factors on a child’s cognitive functioning and development. WAVES measures depend on age. VGCP-I, CDD, decreased spacing, and perseveration scores consistently decreased with age from childhood to adolescence along the process of cognitive development, suggesting a progressive improvement of visuospatial construction. Our findings are consistent with results from other studies in which the accuracy of reproduction in visuographomotor drawing tasks increased with age and plateaued in adolescence.19–22 WAVES scores were also influenced by health status (i.e., chronic neurologic or medical disease or prolonged exposure to psychosocial stress and deprivation), as higher inaccuracy of reproduction was associated with poor health status.
Limitations and Conclusion
An important limitation of our research relates to the characteristics of the study sample, which were not representative of the entire Zambian population due to the composition and limited size. For instance, the majority of participants were from an urban area, whereas most of the Zambian pediatric population lives in rural areas. It should also be noted that all participants had access to education and had regular attendance at school. However, in Zambia, as in other Sub-Saharan countries, many children of school age attend school irregularly or not at all due to occasionally insufficient educational provisions, as well as circumstances such as displacement by traumatic life events (e.g., following the death of the child’s mother), poverty, severe social deprivation, or neglect. Furthermore, robust evidence shows that exposure to formal schooling is associated with improved performance on cognitive testing.5
The development of normative data is a critical requirement to enable a valid and efficient use of WAVES in healthcare and research settings. A new field trial on a larger and representative normative sample should aim to determine an accurate set of norm values, along with the preparation of guidelines for healthcare professionals regarding the interpretation of these norm values. Future work on norming samples should prioritize enrolling a representative group of children living in rural areas, as well as a group of children who do not attend school, to minimize the risk for misdiagnosis in children with a limited exposure to educational settings. Ideally, standard norming guidelines should be based on a nationally representative sample that reflects the socioeconomic and cultural characteristics of the entire country, including ethnicity, primary language spoken at home, poverty rate, and Zambian geographic region.
Other limitations relate to the study design, which allowed only an initial and partial assessment of WAVES psychometric properties. However, study results do enable and inform next steps of the validation process.
First, a comprehensive assessment of measurement invariance should be conducted. Measurement invariance ensures that the VGCP construct has the same interpretation to those groups or across repeated measurements. Testing for VGCP invariance across sex, ethnic groups, and sociocultural groups is of a particular interest in Zambia and other Sub-Saharan societies because they are extremely heterogeneous. Since the interpretation of VGCP can change over time as cognitive development progresses, new research should assess invariance across time. Measurement invariance of VGCP should also be evaluated in relation to screening and follow-up evaluations before and after therapeutic intervention.
Second, novel studies should provide supporting evidence for convergent and discriminant validity of WAVES scale scores interpretation. Future evaluations should be carried out to assess the relationship of WAVES scores with other constructs (e.g., intelligence, episodic memory, selective and sustained attention, visual and verbal working memory, executive functioning). The use of diagnostic instruments originally developed in Zambia or imported with cross-cultural validation should be prioritized for use in these studies.
Third, WAVES shows a potential utility for applications in hypothesis-driven or exploratory clinical research and epidemiology. WAVES can contribute by characterizing the effects of widespread disease and psychosocial conditions on child cognitive functioning and development. It may provide information on the extent by which postinfection neurocognitive complications prevent the child’s full development and relate to psychosocial burden, a punctual estimation of the negative impact of malnutrition on cognitive development, the consequences of situations of early neglect and severe social deprivation on cognitive development, and the modality of psychological adjustment to traumatic life events. New research should address the clinical utility and diagnostic accuracy (i.e., sensitivity and specificity) of WAVES in relation to specific disease conditions.
Finally, WAVES measures could also be validated for use in clinical trials for the purpose of diagnostic classification or as evaluation outcomes to determine clinical benefits, safety risk, and cost efficiency of intervention programs. Investigations should be undertaken to evaluate WAVES reliability when the purpose of the measurement is prediction or monitoring of medical intervention (e.g., evaluation of a therapeutic treatment).
In conclusion, WAVES is a viable and reliable methodology to evaluate visuospatial construction in a Zambian school-aged population. The study warrants further validation of the use of WAVES in healthcare and clinical research settings.
Acknowledgments
The authors acknowledge the contribution to the successful conduct of the study of all members of the Zambia Paediatric Cognitive Assessment Working-Group: Virginia Chanda, Ornella Ciccone, Prisca Kalele, Kalima Kalima, Nfwama Kawatu, Sylvia Mwanza-Kabaghe, Lisa Nkole, Somwe Somwe, Aaron Phiri, Mercy Sulu, and Owen Tembo.
References
- Fernald LCH, Prado E, Kroger P, Raikes A. Toolkit for Measuring Early Childhood Development in Low- and Middle-Income Countries. International Bank for Reconstruction and Development/The World Bank; 2017. https://openknowledge.worldbank.org/bitstream/handle/10986/29000/WB-SIEF-ECD-MEASUREMENT-TOOLKIT.pdf?sequence=1. Accessed 17 Jan 2023.
- Stemler ES, Chukwu F, Chart H, et al. Assessing competencies in reading and mathematics in Zambian children. In: Grigorienko E, ed. Multicultural Psychoeducational Assessment. Springer; 2009:159–160.
- Deregowski JB, Serpell R. Performance on a sorting task: a cross cultural experiment. Int J Psychol. 1971;6(4):273–281.
- Fink G, Matafwali B, Moucheraud C, Zuilkowski SS. The Zambian Early Childhood Development Project: 2010 Assessment Final Report. Harvard University; 2012.
- Matafwali B, Serpell R. Design and validation of assessment tests for young children in Zambia. In: Serpell R, Marfo K, eds. Child Development in Africa: Views from Inside: New Directions for Child and Adolescent Development. Wiley; 2014:77–96.
- Mulenga K, Ahonen, T, Aro M. Performance of Zambian children on the NEPSY: a pilot study. Dev Neuropsychol. 2001;20(1):375–383.
- Wicherts JM, Dolan CV, Carlson JS, van der Maas HLN. Raven’s test performance of Sub-Saharan Africans: Average performance, psychometric properties, and the Flynn effect. Learn Individ Differ. 2010;20(3):135–151.
- Zuilkowski SS, McCoy DC, Serpell R, et al. Dimensionality and the development of cognitive assessments for children in Sub-Saharan Africa. J Cross Cult Psychol. 2016;47(3):341–354.
- Serpell R. Preference for specific orientation of abstract shapes among Zambian children. J Cross Cult Psychol.1971;2(3):225–239.
- Serpell R. How specific are perceptual skills? A cross of pattern reproduction. Br J Psychol. 1979;70:(3)365–380.
- Serpell R, Boykin W. Cultural dimensions of cognition: a multiplex, dynamic system of constraints and possibilities. In: Sternberg RJ, ed. Thinking and Problem Solving. Academia Press; 1994:369–408.
- Benton A, Trandel D. Visuoperceptual, visuospatial, and visuoconstructive disorders. In: Heilman KM, Valenstein E, eds. Clinical Neuropsychology, 2nd edition. Oxford University Press; 1993:195.
- Mervis CB, Robinson FB, Pani RJ. Cognitive and behavioural genetics ’99: visuospatial construction. Am J Hum Genet. 1999;65:1222–1229.
- StataCorp. Stata: Release 15. Statistical Software. StataCorp LL; 2017.
- Hair JF, Black WC, Babin JB, Anderson ER. Multivariate Data Analysis, 7th edition. Pearson; 2010:102.
- Hair JF, Black WC, Babin JB, Anderson ER. Multivariate Data Analysis, 7th edition. Pearson; 2010:116.
- Cicchetti DV. Guidelines, criteria, and rules of thumb for evaluating normed and standardized assessment instruments in psychology. Psychol Assess.1994;6(4):284–290.
- Koo TK, Li MY. A guideline of selecting and reporting intraclass correlation coefficients for reliability research. J Chiropr Med. 2016;15(2):155–163. Erratum in: J Chiropr Med. 2017;16(4):346.
- Arango-Lasprilla JC, Rivera D, Ertl MM, et al. Rey-Osterrieth Complex Figure – copy and immediate recall (3 minutes): normative data for Spanish-speaking pediatric populations. NeuroRehabilitation. 2017;41(3):593–603.
- Conson M, Siciliano M, Baiano C, et al. Normative data of the Rey-Osterrieth Complex Figure for Italian-speaking elementary school children. Neurol Sci. 2019;40(10):2045–2050.
- Del Giudice E, Grossi D, Angelini R, et al. Spatial cognition in children. I. Development of drawing-related (visuospatial and construction) abilities in preschool and early school years. Brain Dev. 2000;22(6):362–367.
- Senese VP, De Lucia N, Conson M. Cognitive predictors of copying and drawing from memory of the Rey-Osterrieth complex figure in 7- to 10-year-old children. Clin Neuropsychol. 2015;29(1):118–132.
- Hu L, Bentler PM. Cutoff criteria for fit indexes in covariance structure analysis: conventional criteria versus new alternatives. Struct Equ Model Multidiscip J. 1999;6(1):1–55.