
 by Anthony L. Vaccarino, PhD; Amir H. Kalali, MD; Pierre Blier, MD, PhD; Susan Gilbert Evans, MSc; Nina Engelhardt, PhD; Jane A. Foster, PhD; Benicio N. Frey, MD, PhD; John H. Greist, MD; Kenneth A. Kobak, PhD; Raymond W. Lam, MD, FRCPC; Glenda MacQueen, MD, PhD, FRCPC; Roumen Milev, MD, PhD, FRCPsych, FRCPC; Daniel J. Müller, MD, PhD; Sagar V. Parikh, MD, FRCPC; Franca M. Placenza, PhD; Sakina J. Rizvi, PhD; Susan Rotzinger, PhD; David V. Sheehan, MD, MBA; Terrence Sills, PhD; Claudio N. Soares, MD, PhD; Gustavo Turecki, MD, PhD; Rudolph Uher, MD, PhD; Janet B.W. Williams, PhD; Sidney H. Kennedy, MD, FRCPC, FRCPsych, FCAHS, FRSC; and Kenneth R. Evans, PhD
Drs. Vaccarino, Evans and Gilbert Evans are with Indoc Research in Toronto, Ontario, Canada. Dr Kalali is with the International Society for CNS Drug Development in San Diego, California. Dr. Blier is with the Departments of Psychiatry and Cellular & Molecular Medicine at the University of Ottawa Institute of Mental Health Research in Ottawa, Ontario, Canada. Dr. Engelhardt is with Intra-Cellular Therapies in New York, New York. Dr. Foster is with Department of Psychiatry & Behavioural Neurosciences at McMaster University in Hamilton, Ontario, Canada. Dr. Frey is with the Department of Psychiatry and Behavioural Neurosciences at McMaster University and Mood Disorders Program and Women’s Health Concerns Clinic, St. Joseph’s Healthcare in Hamilton, Ontario, Canada. Dr. Greist is with the Department of Psychiatry at the University of Wisconsin School of Medicine and Public Health in Madison, Wisconsin. Dr. Kobak is with the Center for Telepsychology in Madison, Wisconsin. Dr. Lam is with the Department of Psychiatry at the University of British Columbia in Vancouver, British Columbia, Canada. Dr. MacQueen is with Mathison Centre for Mental Health Research and Education at the Department of Psychiatry, University of Calgary in Calgary, Alberta, Canada. Dr. Milev is with the Department of Psychiatry and the Department of Psychology, and Centre for Neuroscience Studies at Queen’s University in Kingston, Ontario, Canada. Dr. Müller is with the Centre for Addiction and Mental Health and the Department of Psychiatry at the University of Toronto in Toronto, Ontario, Canada. Parikh is with the Department of Psychiatry at the University of Michigan in Ann Arbor, Michigan. Dr. Placenza is with the Department of Psychiatry at the Krembil Research Centre, University Health Network, University of Toronto in Toronto, Ontario, Canada. Dr. Rizvi is with Arthur Sommer Rotenberg Program for Suicide and Depression Studies at St. Michael’s Hospital in Toronto, Ontario, Canada. Dr. Rotzinger is with St. Michael’s Hospital (Unity Health Toronto) and Department of Psychiatry at the University of Toronto in Toronto, Ontario, Canada. Dr. Sheehan is with the University of South Florida College of Medicine in Tampa, Florida. Dr. Sills was with OCBN in Toronto, Ontario, Canada. Dr. Soares is with the Department of Psychiatry at Queen’s University and Providence Care Hospital in Kingston, Ontario, Canada. Dr. Turecki is with the Department of Psychiatry at McGill University in Montreal, Quebec, Canada. Dr. Uher is with the Department of Psychiatry at Dalhousie University in Halifax, Nova Scotia, Canada. Dr. Williams is with the Departments of Psychiatry and Neurology at Columbia University in New York, New York. Dr. Kennedy is with the Department of Psychiatry at the University of Toronto and Centre for Depression and Suicide, St. Michael’s Hospital in Toronto, Ontario, Canada.
FUNDING: CAN-BIND is an Integrated Discovery Program carried out in partnership with, and financial support from, the Ontario Brain Institute, an independent nonprofit corporation, funded partially by the Ontario government. CAN-BIND also acknowledges support from the Canadian Institute for Health Research, Lundbeck A/S, Servier, Bristol Meyers Squibb, Lilly, and Johnson & Johnson. Additional funding of the DID initiative provided by Indoc Research. Previous iterations of DID were supported by the International Society for CNS Drug Development (ISCDD) with funding from Eli Lilly and Company. The opinions, results, and conclusions are those of the authors and no endorsement by the Ontario Brain Institute is intended or should be inferred.
DISCLOSURES: The authors have no conflicts of interest relevant to the content of this article.
ABSTRACT: Objective. The goal of the Depression Inventory Development (DID) project is to develop a comprehensive and psychometrically sound rating scale for major depressive disorder (MDD) that reflects current diagnostic criteria and conceptualizations of depression. We report here the evaluation of the current DID item bank using Classical Test Theory (CTT), Item Response Theory (IRT) and Rasch Measurement Theory (RMT).
Methods. The present study was part of a larger multisite, open-label study conducted by the Canadian Biomarker Integration Network in Depression (ClinicalTrials.gov: NCT01655706). Trained raters administered the 32 DID items at each of two visits (MDD: baseline, n=211 and Week 8, n=177; healthy participants: baseline, n=112 and Week 8, n=104). The DID’s “grid” structure operationalizes intensity and frequency of each item, with clear symptom definitions and a structured interview guide, with the current iteration assessing symptoms related to anhedonia, cognition, fatigue, general malaise, motivation, anxiety, negative thinking, pain, and appetite. Participants were also administered the Montgomery–Åsberg Depression Rating Scale (MADRS) and Quick Inventory of Depressive Symptomatology-Self-Report (QIDS-SR) that allowed DID items to be evaluated against existing “benchmark” items. CTT was used to assess data quality/reliability (i.e., missing data, skewness, scoring frequency, internal consistency), IRT to assess individual item performance by modelling an item’s ability to discriminate levels of depressive severity (as assessed by the MADRS), and RMT to assess how the items perform together as a scale to capture a range of depressive severity (item targeting). These analyses together provided empirical evidence to base decisions on which DID items to remove, modify, or advance.
Results. Of the 32 DID items evaluated, eight items were identified by CTT as problematic, displaying low variability in the range of responses, floor effects, and/or skewness; and four items were identified by IRT to show poor discriminative properties that would limit their clinical utility. Five additional items were deemed to be redundant. The remaining 15 DID items all fit the Rasch model, with person and item difficulty estimates indicating satisfactory item targeting, with lower precision in participants with mild levels of depression. These 15 DID items also showed good internal consistency (alpha=0.95 and inter-item correlations ranging from r=0.49 to r=0.84) and all items were sensitive to change following antidepressant treatment (baseline vs. Week 8). RMT revealed problematic item targeting for the MADRS and QIDS-SR, including an absence of MADRS items targeting participants with mild/moderate depression and an absence of QIDS-SR items targeting participants with mild or severe depression.
Conclusion. The present study applied CTT, IRT, and RMT to assess the measurement properties of the DID items and identify those that should be advanced, modified, or removed. Of the 32 items evaluated, 15 items showed good measurement properties. These items (along with previously evaluated items) will provide the basis for validation of a penultimate DID scale assessing anhedonia, cognitive slowing, concentration, executive function, recent memory, drive, emotional fatigue, guilt, self-esteem, hopelessness, tension, rumination, irritability, reduced appetite, insomnia, sadness, worry, suicidality, and depressed mood. The strategies adopted by the DID process provide a framework for rating scale development and validation.
Keywords: Major depressive disorder, rating scales, Classical Test Theory, Item Response Theory, Rasch Measurement Theory, depressive symptoms
Innov Clin Neurosci. 2020;17(7–9):30–40
The Hamilton Depression Rating Scale (HAM-D)1 and Montgomery–Åsberg Depression Rating Scale (MADRS)2 are among the most frequently utilized clinician-rated tools to assess depressive severity and therapeutic efficacy.3 However, a number of shortcomings have been identified with these rating scales, including the inability of some HAM-D4,5,6,7 and MADRS items5,8,9 to discriminate across severity levels of depression, adding unwanted noise that could impact sensitivity to change. Furthermore, since the introduction of these rating scales, our conceptualization and diagnostic framework for major depressive disorder (MDD) have evolved through consecutive revisions to the Diagnostic and Statistical Manual of Mental Disorders (DSM) and the International Classification of Diseases (ICD). To address these shortcomings, the Depression Inventory Development (DID) project aims to develop a comprehensive and psychometrically sound rating scale for MDD that reflects current diagnostic criteria and conceptualizations of depression.10
Using an iterative process between field testing and psychometric analysis, an empirically driven and collaborative protocol has been established for development of DID items to assess severity of depressive symptoms.10 Briefly, depression-relevant symptom clusters were identified based on clinical and patient input and evaluation of existing depression-relevant scales6,11,12,13 to help inform symptom identification and item development. Once items are developed (by DID working groups), they are distributed to trained raters for testing in MDD. Modifications to items are made based on empirical evidence derived from field testing to determine which items should be advanced (with appropriate modifications) to subsequent iterations or removed. The current iteration included 32 items developed to assess symptoms related to anhedonia, cognition, fatigue, general malaise, negative thinking, anxiety, pain, sleep, and appetite; with an interim analysis indicating favorable psychometric properties for many of these items.10 We have now completed data collection, and report here the measurement properties of the DID items by applying three psychometric paradigms: Classical Test Theory (CTT),14 Item Response Theory (IRT),15,16 and Rasch Measurement Theory (RMT).17
CTT is a conventional approach to assess a scale’s psychometric properties, such as reliability, validity, and ability to detect change, and typically uses correlation-based analyses to demonstrate the ability of an item to discriminate subjects with higher or lower levels of the construct assessed (i.e., item-total correlation). However, a major limitation of CTT is that it is sample- and item-dependent, thus reducing the generalizability of the results and prediction of how an individual will respond to a given item on a test or rating scale.14 By contrast, latent trait models, such as IRT and RMT, attempt to explain the relationship between the latent trait assessed and item score by considering an individual’s score on an item as a function of both the “difficulty” of the item and the individual’s trait level.18,19 Although each of these approaches is based on differing methodologies, assumptions, and criteria, they can provide complimentary information during item development.18,19
In the present study, we first applied CTT to assess data quality/reliability. Items that did not meet basic scale measurement criteria (i.e., missing data, skewness, scoring frequency, internal consistency) were removed. Following that, IRT was used to assess individual item performance (of those that passed CTT evaluation) by modeling an item’s ability (at the individual option level) to discriminate levels of depressive severity; poorly discriminating items were removed from further evaluation. Finally, RMT was used to evaluate how the remaining items perform together as a scale to capture a range of depressive severity (item targeting). Using United States Food and Drug Administration (FDA) recommendations as guidance,20 these analyses provided empirical evidence on which to base decisions regarding which items to remove, modify, or advance. In addition to quantitative analyses, clinical opinion was considered throughout.
Methods
Participants. The present study was part of the first Canadian Biomarker Integration Network in Depression antidepressant trial (CAN-BIND-1), which was designed to identify clinical and biological markers of antidepressant treatment response.21,22 Male and female outpatients (n=211) between 18 and 60 years old who had a major depressive episode in the context of MDD, according to the fourth edition (IV), text revision (TR), of the DSM (DSM-IV-TR) criteria, as determined by the Mini International Neuropsychiatric Interview,23 and had a minimum MADRS score of 24, participated in the study. Age- and sex-matched healthy comparison participants with no psychiatric or unstable medical diagnosis (n=112) completed the same clinical, neuroimaging, and blood sampling protocols over 16 weeks, but did not receive antidepressant medication. This study was carried out in accordance with the Declaration of Helsinki and International Conference on Harmonisation (ICH), and the study design and procedures were reviewed by the appropriate ethics committees. Informed consent was obtained from all participants after full explanation of the nature of the procedures. Statement of Research Ethics Board approval was obtained at each participant site. The trial was registered at ClinicalTrials.gov (identifier: NCT01655706).
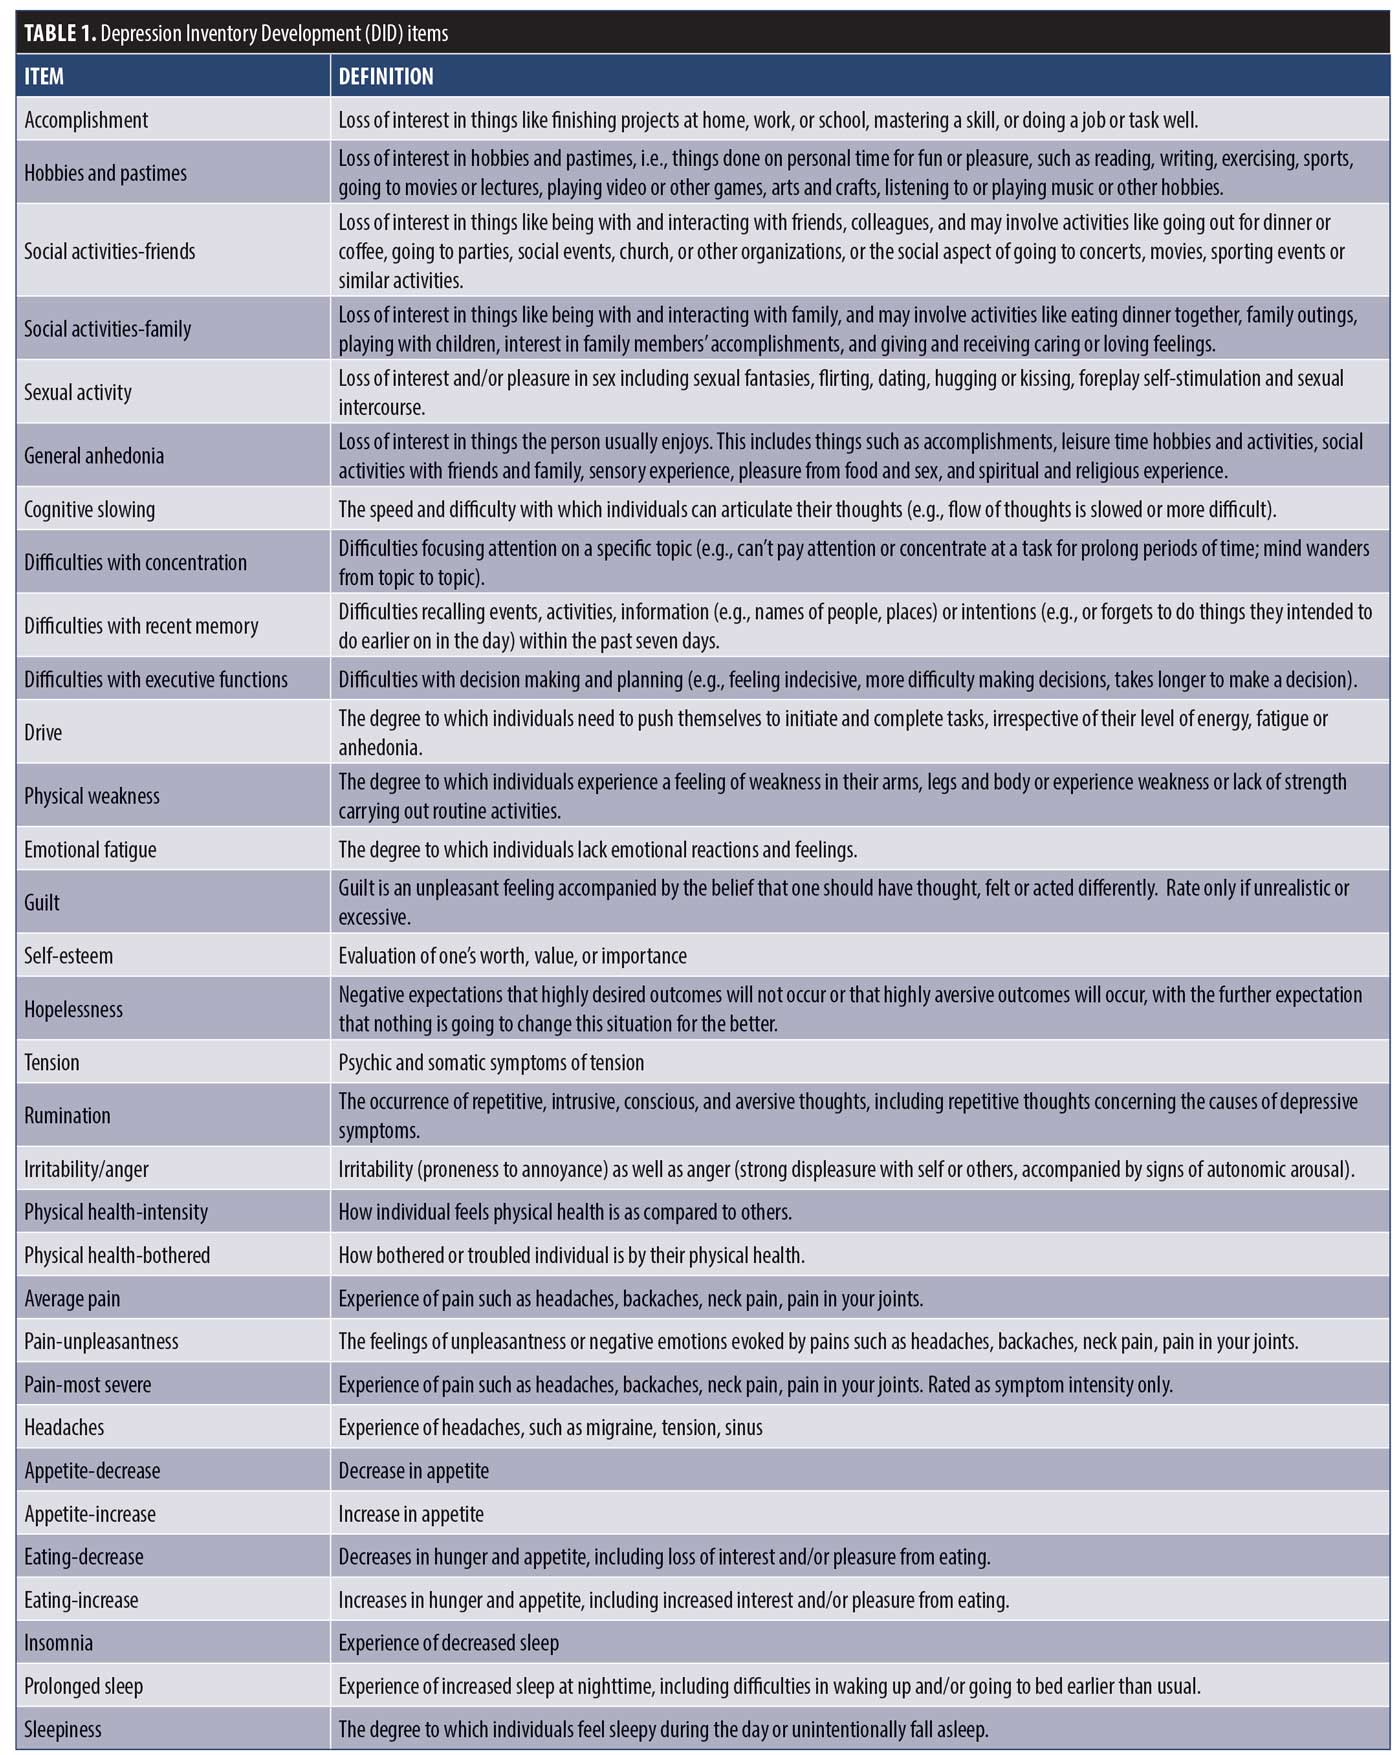
Item administration. Participants were administered the 32 DID test items (Table 1) using a semi-structured interview guide adapted from the GRID-HAM-D24 at each of two post screen visits (MDD group—baseline, n=211; Week 8, n=177; and healthy participants—baseline, n=112, Week 8, n=104). Raters received training in standardized conventions for scoring, anchor and item definitions, and in the use of the DID structured interview guide. DID items were scored on a “grid” of intensity (Absent, Mild, Moderate, Severe, Very Severe) and frequency (Never/Absent, Rarely/Sometimes, Frequently, Almost all the time/Always), with the intersection comprising composite item scores that were used in the analyses (score range 0–4).10,24 Participants were also administered the MADRS2 and completed the Quick Inventory of Depressive Symptomatology-Self-Report (QIDS-SR)25 that allowed the DID items to be evaluated against existing “benchmark” items. Demographic information, DID, and MADRS assessments were captured electronically using OpenClinica Enterprise Edition (OpenClinica LLC, Waltham, Massachusetts) and QIDS-SR using LimeSurvey (LimeSurvey, Hamburg, Germany) using the Brain-CODE informatics platform.26
Item analysis. Using FDA recommendations as guidance,10,20 a series of analyses were conducted using CTT, IRT, and RMT to assess the psychometric properties of the DID items and determine which ones should be removed from the item bank, modified, or advanced to the final scale.
CTT model. As a first step, the 32 DID items were examined for data quality using the following CTT acceptability criteria:10
- Missing data <10%
- Endorsement of zero or maximum option score <80%
- Endorsement of any single option <50%
- Aggregate frequency endorsement of adjacent options, <10%
- Skewness <|2|
- Inter-item correlations r<0.75
- Item-total correlations r>0.30
- Cronbach’s Alpha r>0.70
As the entry criteria (MADRS >24) would in effect reduce variability and skew the data toward higher scores at baseline, CTT analyses were applied to Week 8 MDD participant data (n=177). In the present sample, 47 percent were considered to be responders at Week 8,22 resulting in a broad range of total MADRS scores (0–49, Skewness=0.48). All CTT analyses were carried out using SPSS Version 25.
IRT model. Following the CTT item deletion process, the remaining items were assessed by IRT, which is based on the premise that an individual item on a scale should have a direct relationship to the underlying construct it is supposed to measure16 and reflects how informative an individual DID item is as a measure of overall depression severity (i.e., construct validity). Although CTT analyses also address construct validity (i.e., item-total correlations), IRT provides additional information across scoring options with an individual item that can help to inform item revisions, including measurement precision across different levels of severity.10
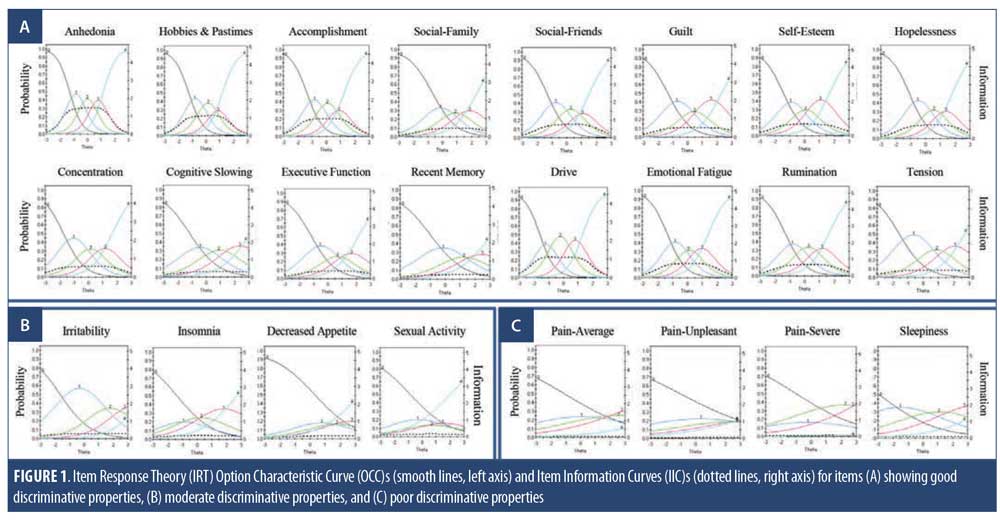
Individual DID items were analyzed separately against the 10 MADRS items using Samejima’s Graded Response Model27 in IRTPro Version 4.2 (Scientific Software International, Skokie, Illinois). Option Characteristic Curves (OCCs) were generated to display the probability of selecting a particular score on a DID item (e.g., 0, 1, 2, 3, 4) as a function of overall depressive severity (MADRS). An item is considered informative if characterized by a clear identification of the range of severity scores over which an option is most likely to be endorsed, rapid changes in the curves that correspond to changes in severity, and an orderly relationship between the weight assigned to the option and the region of severity over which an item is likely to be endorsed.11,15,16 Visual examination of OCCs provided the basis for removal of items that displayed poor discriminative properties, as well as the basis to modify items to improve their measurement properties.
Item Information Curves (IICs) were also generated to illustrate the measurement precision of an item, with increased slope of the line indicating the item provides more information. IICs also illustrate the trait level at which the item is most informative, such that an item’s psychometric qualities can vary across different levels of severity. Discriminatory/slope (denoted as “a”) and threshold parameter estimates (denoted as “b”) provided quantitative measures of item discrimination, with slope parameters of a<0.65 used as an indication of low discriminatory properties.28 To ensure a broad range of coverage of depressive severity, data were pooled across the two visits (baseline and Week 8, n=388).
In this setting, we assume one underlying latent trait: depressive severity as indicated by MADRS total score. In IRT, it is generally accepted that the assumption of unidimensionality cannot be strictly met due to the many factors that can affect test performance (e.g., cognition, personality traits). As a result, demonstrating dominance of a single factor is sufficient to satisfy this assumption (e.g., >20% variance accounted for by first factor).29,30 Principal component analysis of the MADRS (at Week 8) revealed that 53 percent of the total variance can be explained by the first factor and scree plot of eigenvalues, suggesting a single dominant factor with the first value substantially larger than the rest (5.3, 1.0. 0.77, 0.63, 0.59, 0.46…).
RMT model. Following IRT analyses, RMT was used to assess the performance of the remaining items together as a scale. RMT (and IRT) consider the probability of an item’s score as a function of both the person’s individual trait level (i.e., depressive severity) and the item’s difficulty (i.e., level of depressive severity that item assesses).17 In contrast to CTT and IRT that describe the data, RMT describes how well the data fit the Rasch model.19 Items that do not fit the model indicate that they are measuring more than one variable, thus providing a measure of construct validity in that the item is measuring what it is supposed to measure. Item fit statistics were calculated as an index of how much the observed score for an item deviates from the expected score of the Rasch model. Items that did not fit the model (misfits) were considered for removal, as they do not contribute to measurement of the underlying construct and add unwanted noise to the scale. Item “infit” mean square (MNSQ) values provide a fit index for items that are in close proximity to the person’s severity, and “outfit” MNSQ values for differences between observed and expected values for items that are far from the person’s severity level. MNSQ values between 0.5 and 1.5 are considered to be acceptable variations between model and observed scores, with values greater than 2.0 flagged as misfits.31
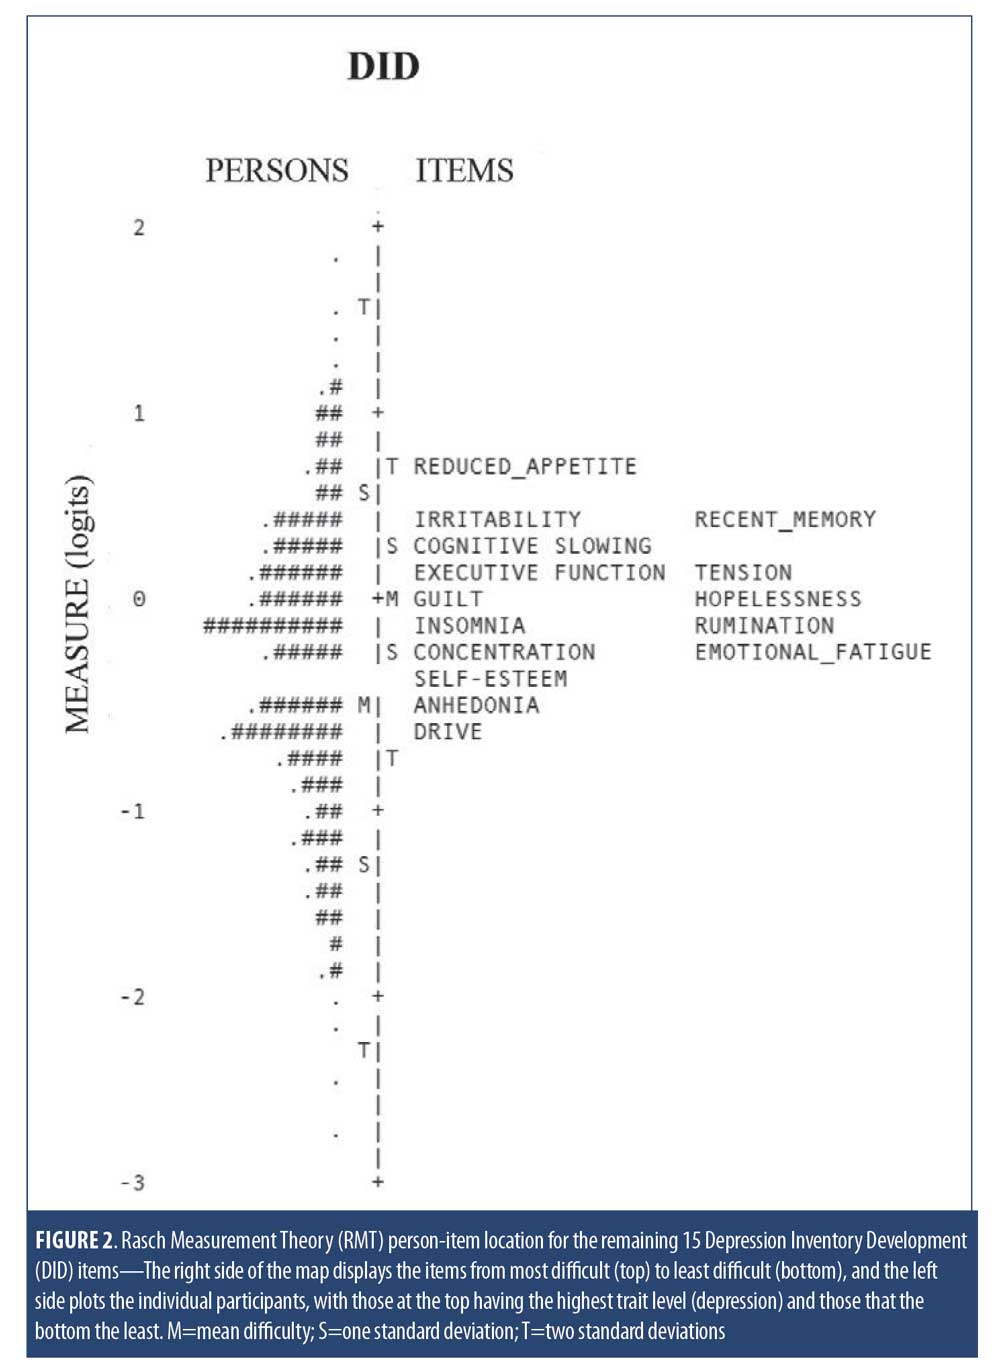
Following evaluation of item fit, the remaining items were evaluated together as a scale. Person-item maps were generated that plot individual study participants and items on a single continuum to compare the range and position of the person measure distribution to that of the item measure distribution.17 Both item difficulty and person “ability” (in this case, level of depression) are presented together on a logit scale (i.e., log of the odds); the right side of the map displays the items from most difficult (top) to least difficult (bottom) and the left side plots the individual participants, with those at the top having the highest trait level (depression) and those at the bottom the least. In this regard, the clinical utility of summing individual items from a scale to form a total score of overall severity requires that the items be spread out across the severity level of a broad range of persons.32,33 In addition, gaps between items are problematic, as persons falling within those gaps cannot be differentiated from one another. All Rasch analyses were carried out using WinSteps Version 4.2 (www.winsteps.com).
Results
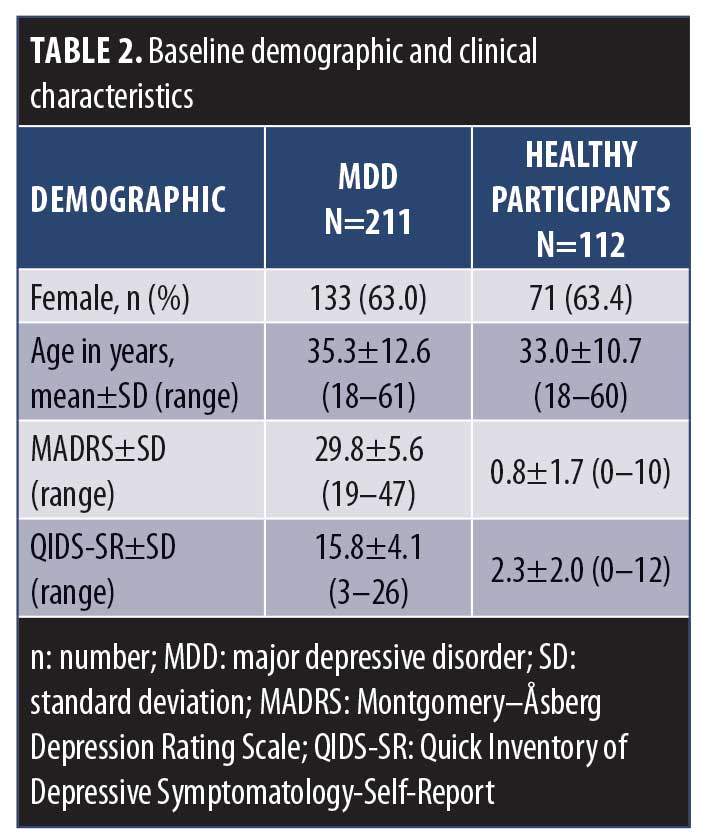
Participant characteristics. Baseline demographic and clinical characteristics for the MDD cohort and healthy participants are shown in Table 2. The mean MADRS and QIDS-SR total scores indicated that the MDD participants were overall “moderately” depressed at baseline. The higher proportion of female participants (63%) in the MDD cohort is representative of the higher rates of depression among the female sex than the male sex.34,35,36 Mean age and sex proportion did not differ between MDD and age- and sex-matched healthy participants.
CTT analysis. The results of the CTT analysis are summarized in Table 3. Missing data were not a concern, ranging from 0 to 2.8 percent. Only one item displayed a floor effect (Increased Eating). However, a number of items were problematic in their variability and response range: 10 items had a single option frequency of more than 50 percent (Decreased Appetite, Increased Appetite, Decreased Eating, Increased Eating, Headaches, Physical Health–Bothered, Physical Health–Intensity, Irritability/Anger, Prolonged Sleep, Physical Weakness), six of which had aggregate frequencies of less than 10 percent (Increased Appetite, Decreased Eating, Increased Eating, Headaches, Irritability/Anger, Prolonged Sleep, Physical Weakness), and two of which were skewed (Increased Appetite and Increased Eating).
Based on the CTT analyses (Table 3), eight items were removed from the item bank because of low variability in the range of response options selected, floor effects, and/or skewness: Increased Appetite, Decreased Eating, Increased Eating, Headaches, Physical Health–Bothered, Physical Health–Intensity, Prolonged Sleep, and Physical Weakness. Although data quality issues were also identified for Irritability/Anger (single option frequency of >50% and aggregate frequencies of <10%) and for Decreased Appetite (single option frequency of >50%), these items were retained for further analysis with possibility of item revisions, based on clinical opinion and literature supporting their roles in MDD.37
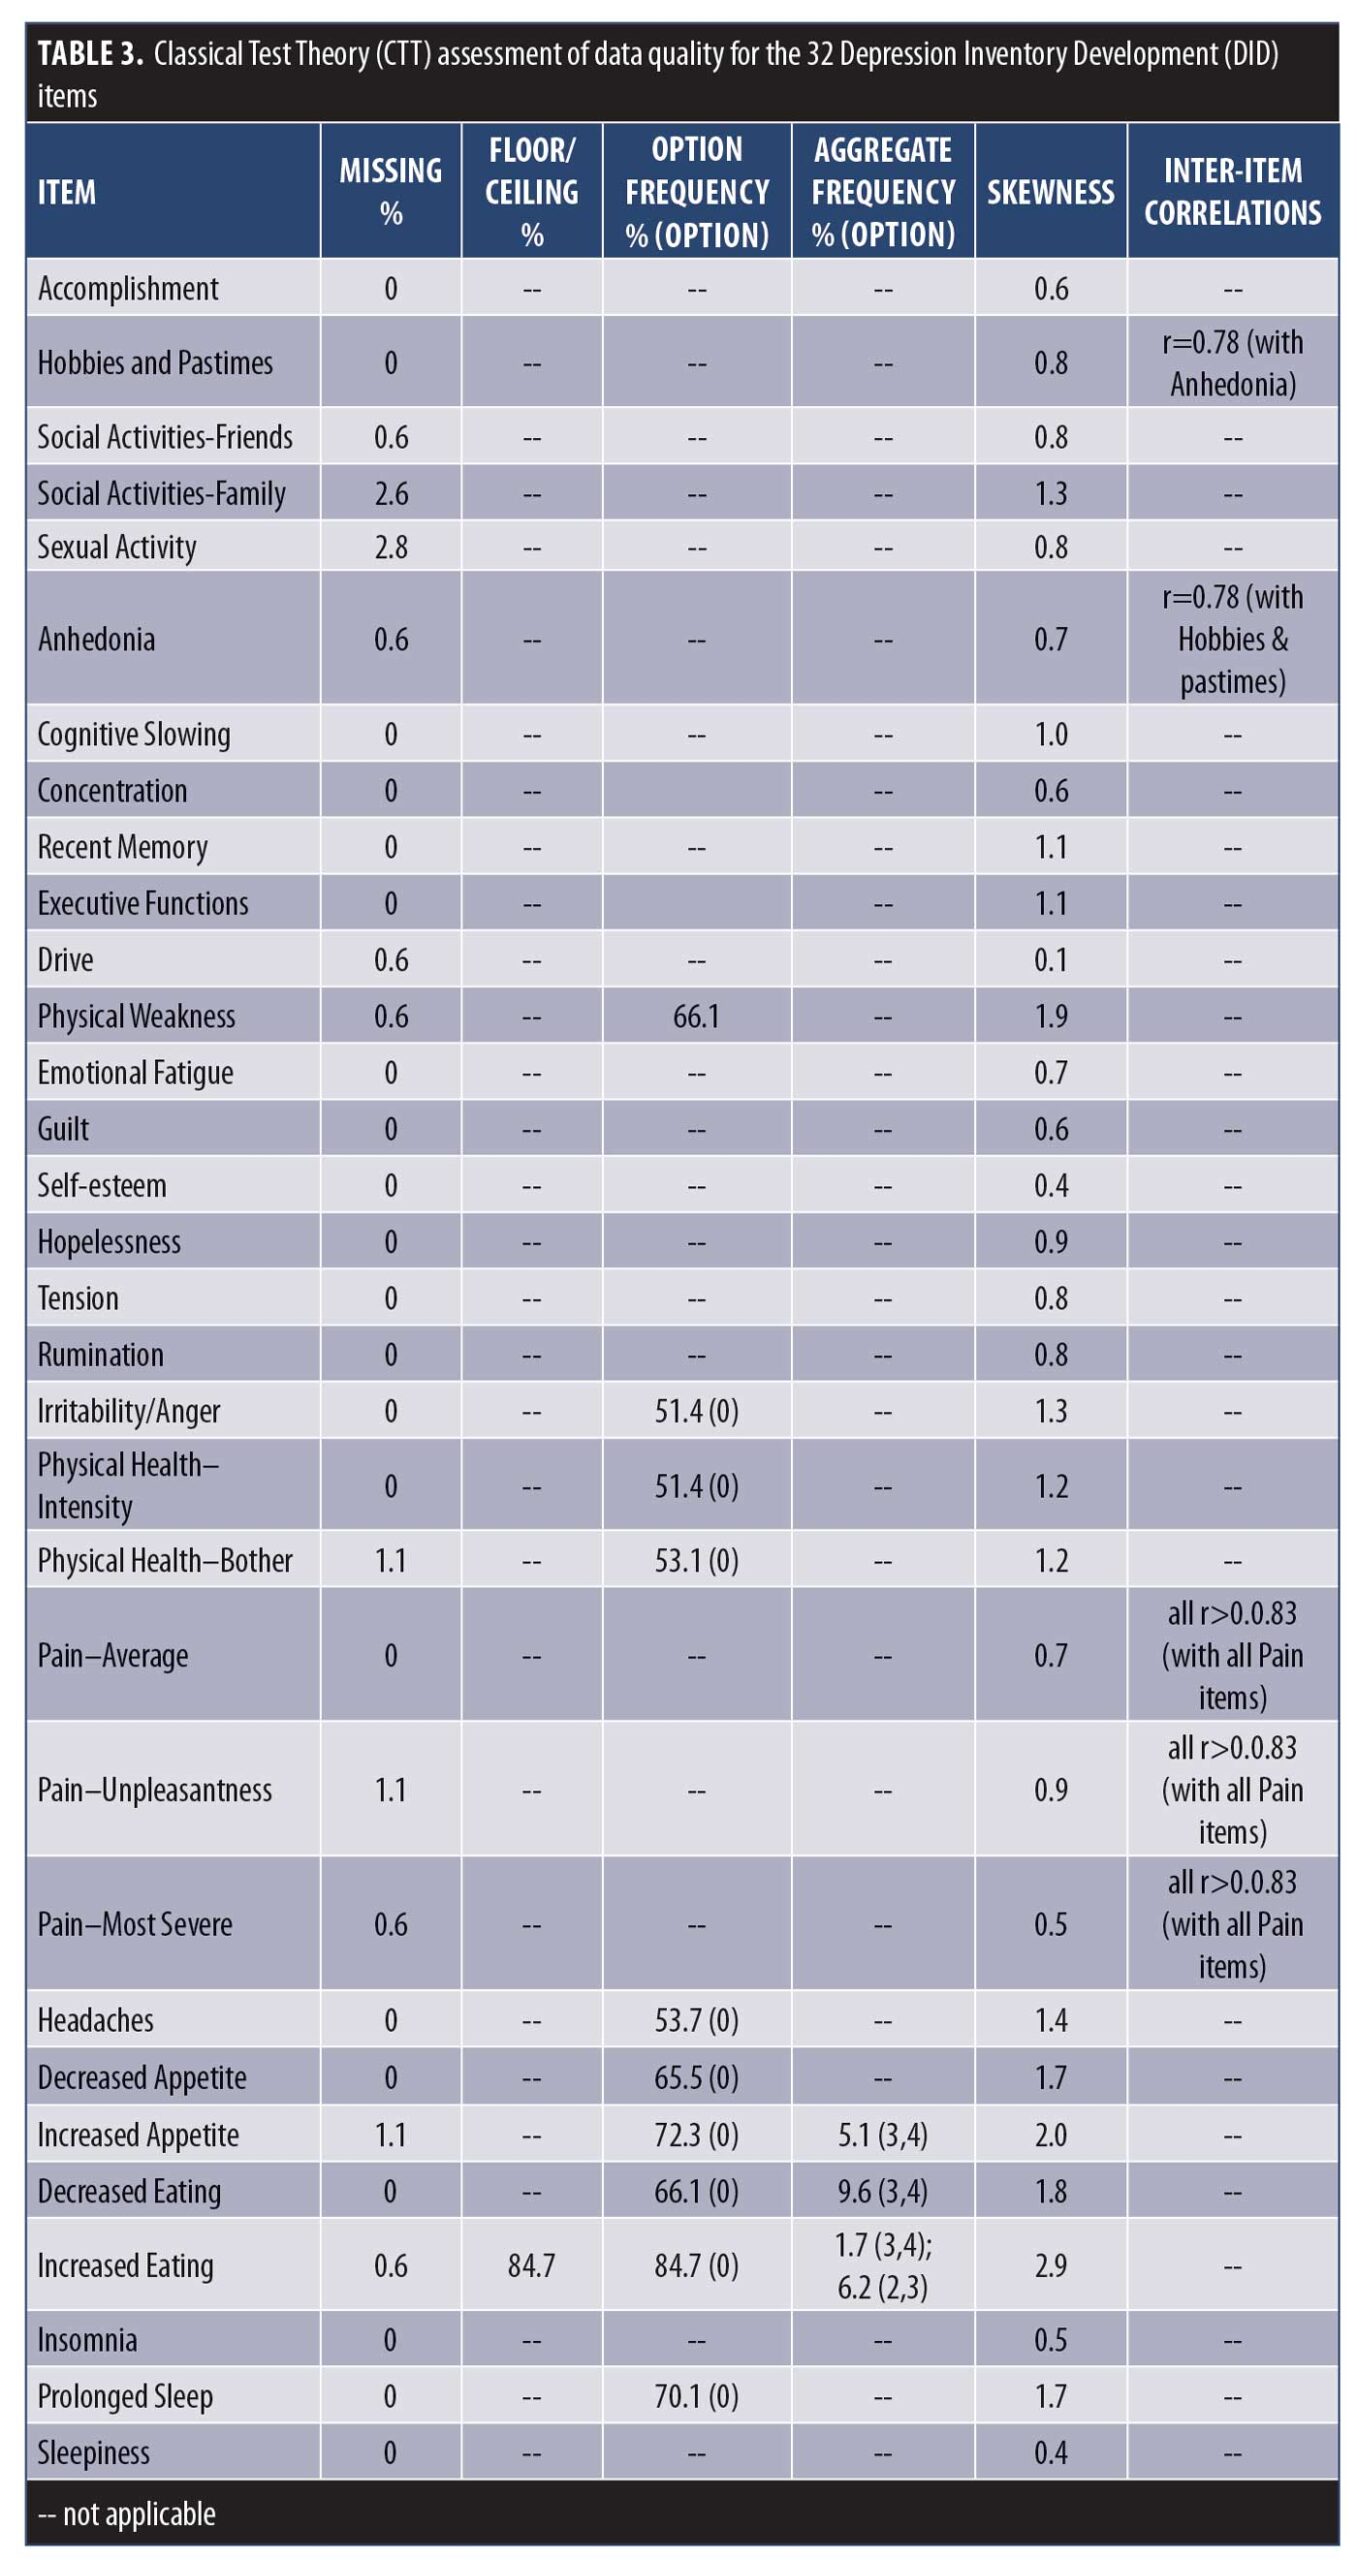
As part of the DID process, general symptom domains are deconstructed into testable constituent symptom definitions.10,38 In the present study, the concept of “anhedonia” was assessed separately by Hobbies and Pastimes, Accomplishment, Social Activity–Friends, Social Activity–Family, Sexual Activity, and Anhedonia. The inter-item correlation between Anhedonia and Hobbies and Pastimes (r=0.78) suggests that these two items are measuring the same construct (i.e., redundancy). Similarly, the concept of “pain” was assessed separately by Pain–Average, Pain–Unpleasantness, and Pain–Most Severe, with correlations among these items indicating redundancy (r=0.83–0.89). In recommending which items should be used to represent these concepts, the items with the best measurement properties should be retained. However, as all of these items displayed acceptable CTT properties (Table 3), no informed decision could be made on the basis of these results alone. As such, these items were assessed further using IRT to determine which items were best able to discriminate levels of depression and thus could be used to represent those concepts.
IRT analysis. The remaining 24 DID items were advanced to psychometric evaluation using IRT modeling to assess their ability to discriminate across levels of depressive severity (MADRS). The OCCs and IICs for these items are displayed in Figure 1, and item discriminatory/slope and threshold parameter estimates are listed in Table 4. Of the 24 DID items assessed by IRT, 16 showed ideal or close to ideal OCCs that included rapid changes in the curves corresponding to changes in severity, and an orderly relationship between the weight assigned to the option and the region of severity over which an item is likely to be endorsed (Figure 1A), with discriminatory/slope parameter estimates ranging from a=0.88 (Recent Memory) to 2.20 (Anhedonia) and threshold parameters covering a broad range of severity, ranging from -1.73 (Concentration, b1) to 3.13 (Recent Memory, b4) (Table 4). Four additional items (Irritability, Insomnia, Sexual Activity, and Decreased Appetite) were found to show moderate discrimination, with discriminatory/slope parameter estimates between a=0.70 (Sexual Activity) and 0.96 (Irritability) (Figure 1B, Table 4). The three Pain items and the Sleepiness item were problematic and were removed from the item bank, due to their poor discriminative properties, which limit their clinical utility, as indicated by OCCs, IICs (Figure 1C), and discriminatory/slope parameter estimates (a=0.35–0.52, Table 4).
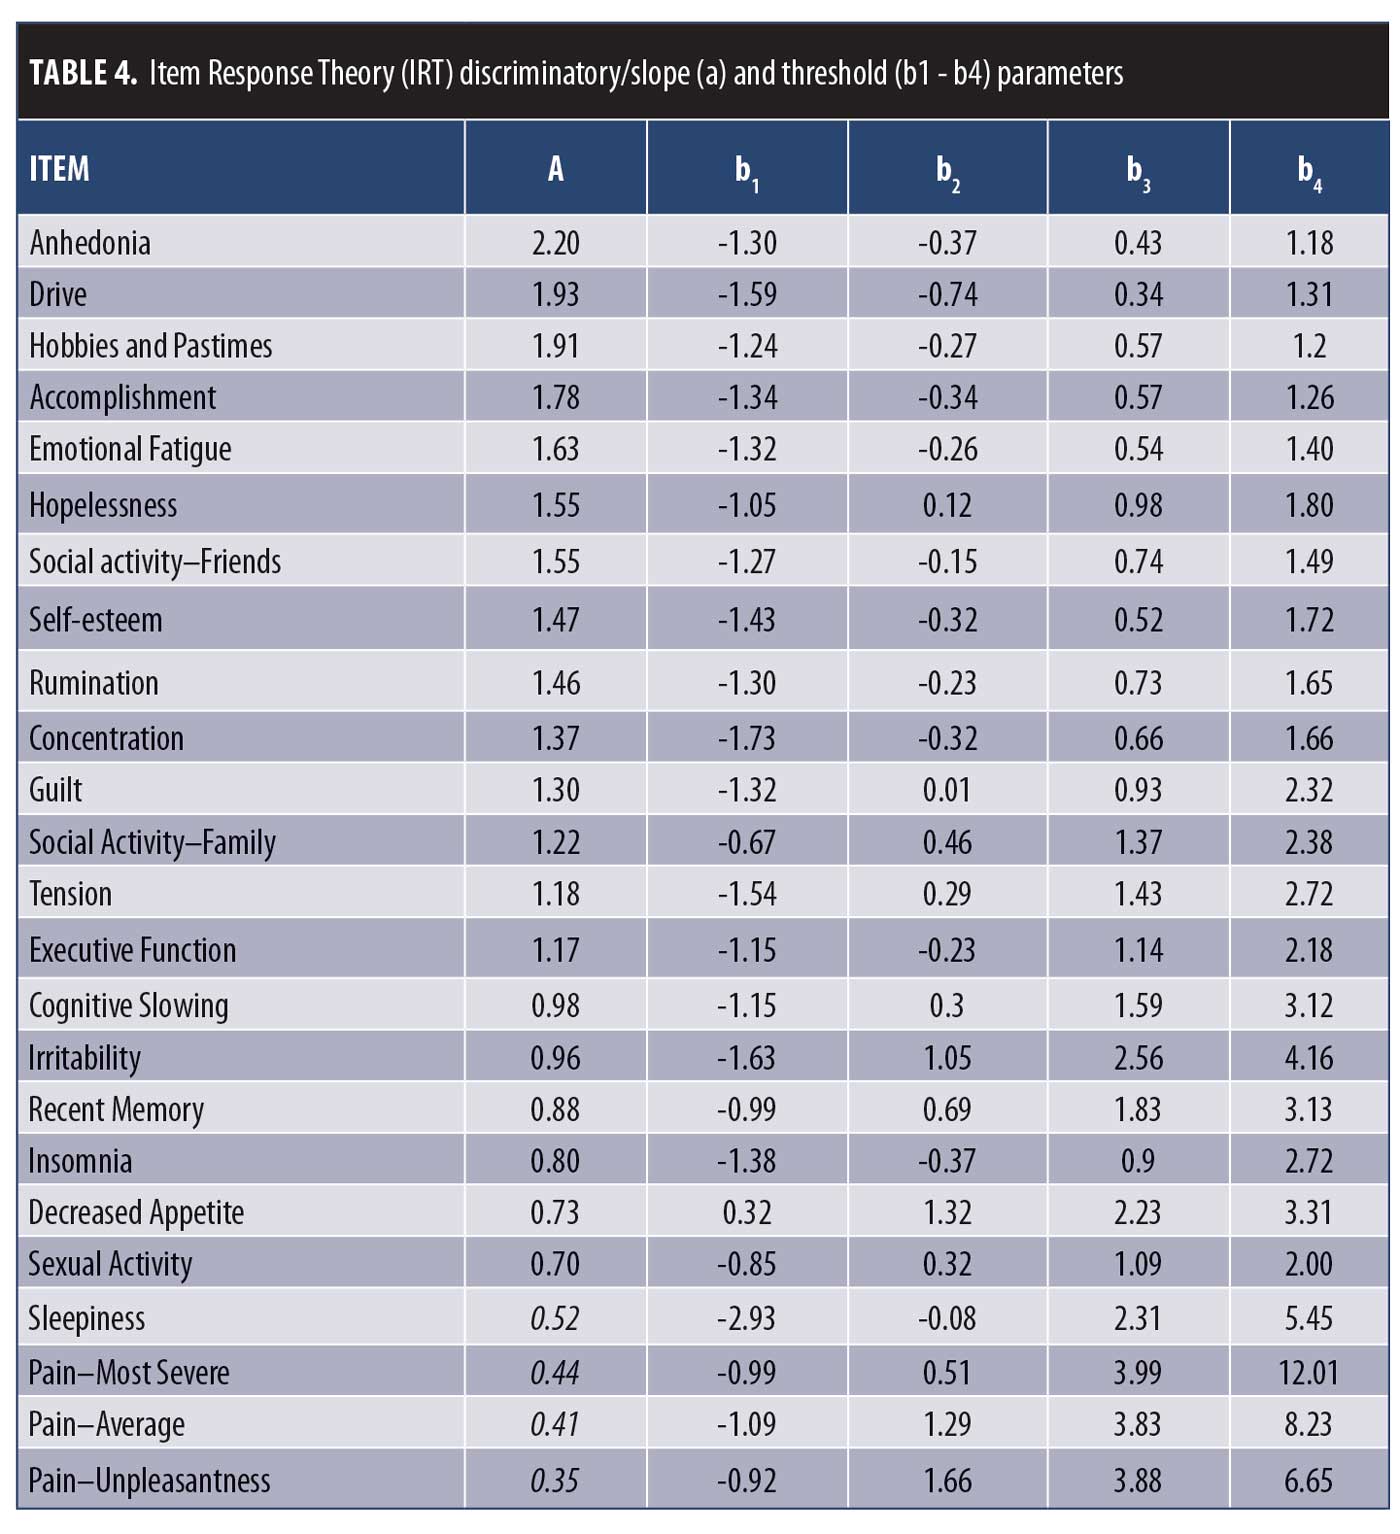
Among the six items assessing anhedonia, the Anhedonia item displayed the best IRT measurement properties (Figure 1 and Table 4). As such, the Hobbies and Pastimes item was removed due to redundancy with Anhedonia (r=0.78). In addition, Accomplishment, Social Activity–Friends, Social Activity–Family, and Sexual Activity were removed due to these concepts being adequately captured within the general Anhedonia item (“Assesses loss of interest in things the person usually enjoys. This includes things such as accomplishments, leisure time hobbies and activities, social activities with friends and family, sensory experience, pleasure from food and sex, and spiritual and religious experience.”) (Table 1).
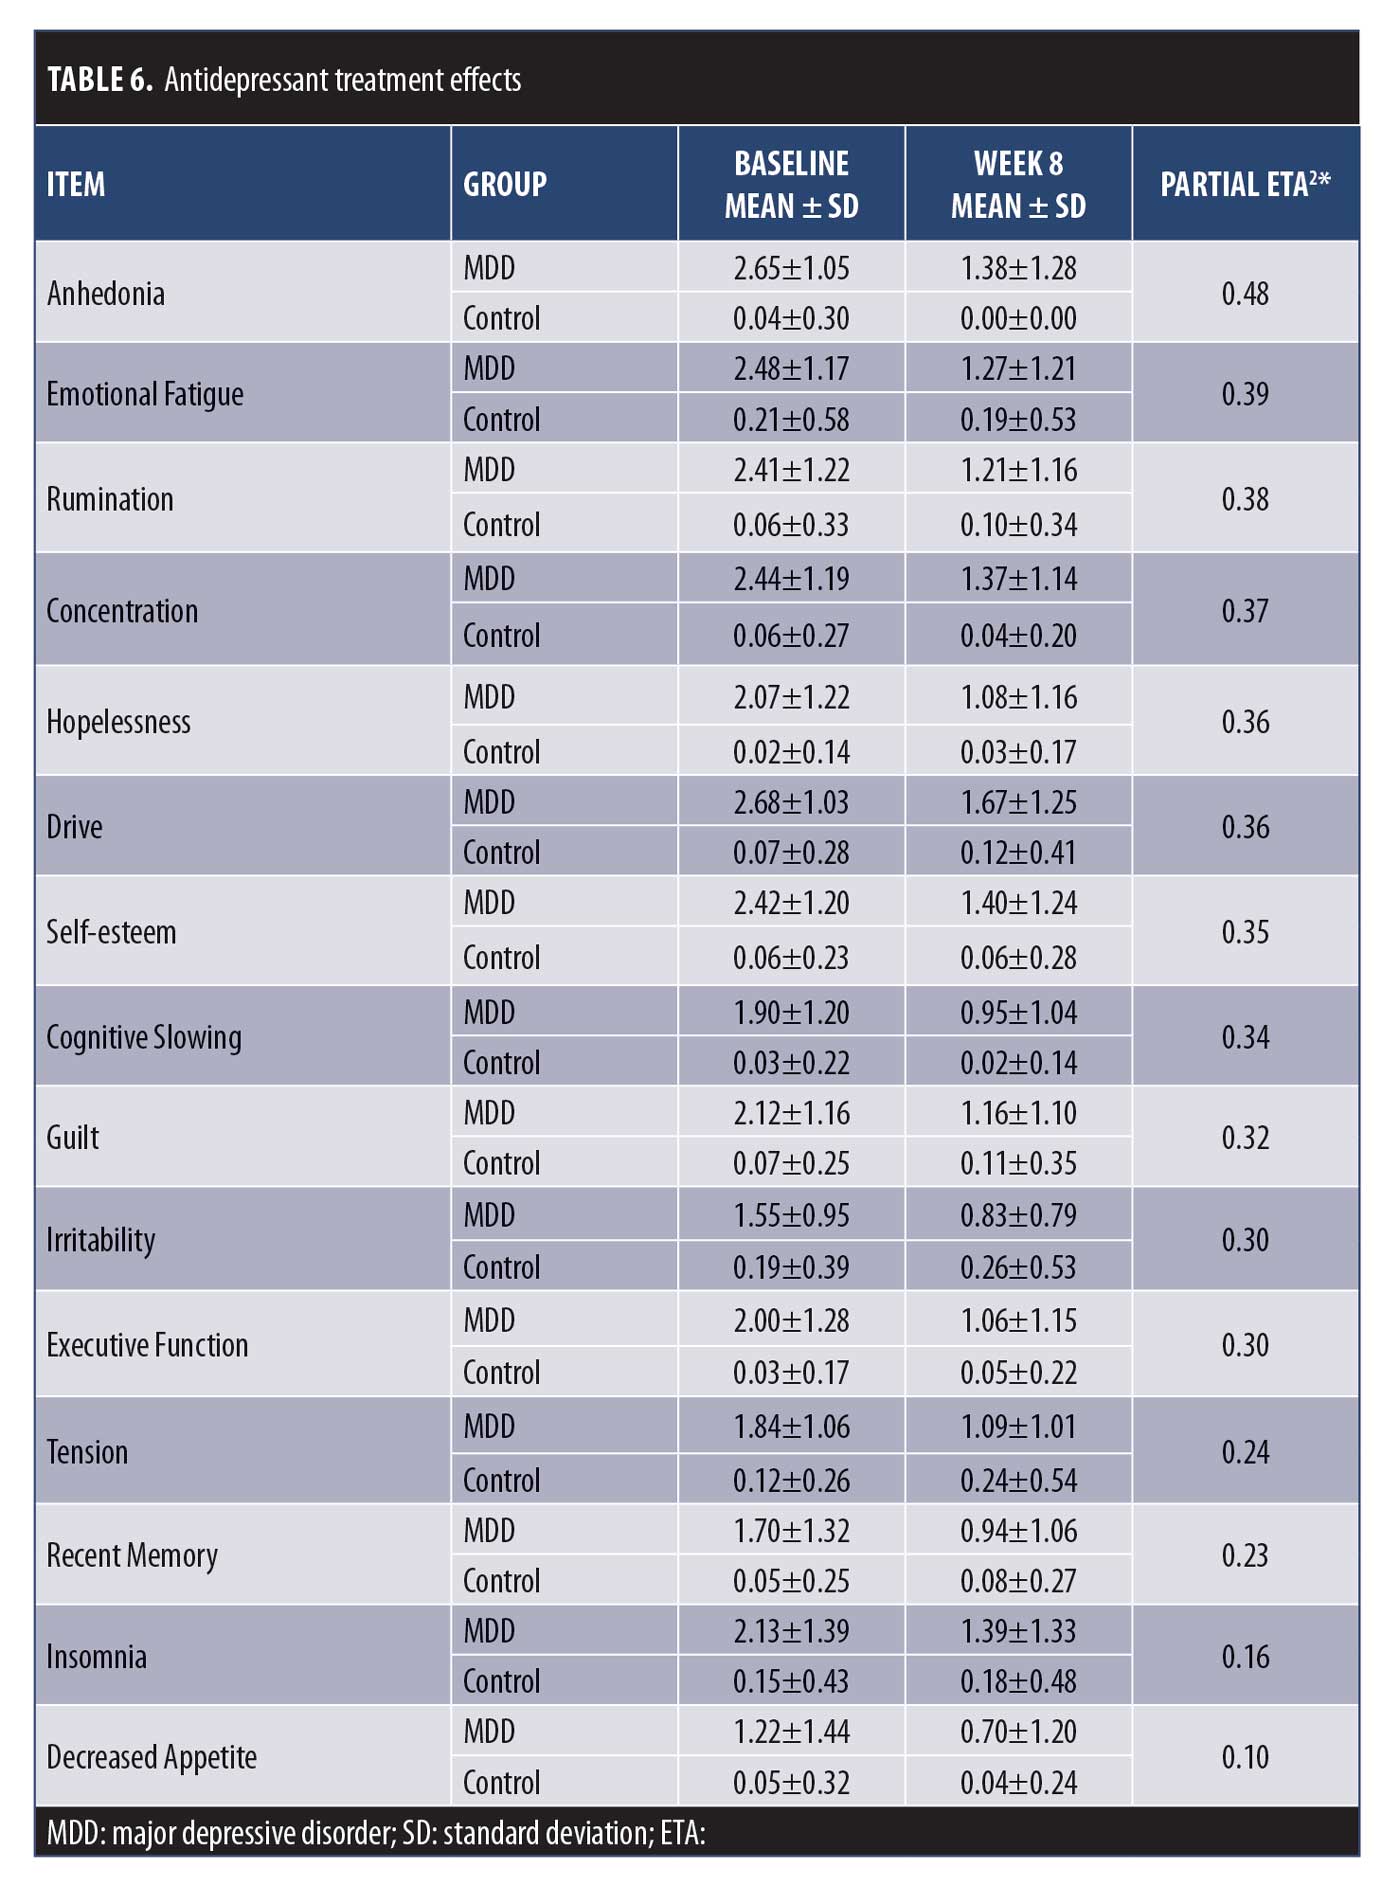
Cognitive dysfunctions in MDD are often reported and are associated with greater functional impairment and a poorer clinical outcome.39,40 However, despite impairments being noted across a number of cognitive domains, including executive function, memory, attention, concentration, slowed thinking, and decision making,39,40 most depression rating scales assess only difficulties with concentration (e.g., QIDS-SR: Concentration/Decision Making; MADRS: Concentration Difficulties; Beck’s Depression Inventory (BDI): Concentration Difficulty: Patient Health Questionnaire-9 (PHQ-9): Trouble Concentrating), and in some instances do not consider cognitive dysfunction at all (e.g., HAM-D-17). In the present study, cognition was assessed separately as Difficulties with Concentration, Difficulties with Executive Function, Cognitive Slowing, and Difficulties with Recent Memory. When compared to healthy participants, cognitive deficits were noted in each of these domains (Table 6, baseline) that discriminated across levels of depression severity (Figure 1A and Table 4). Inter-item correlations among the cognitive items (r=0.46–0.60) suggest that although they are related, they are sufficiently distinct to serve as separate measures. These items will be advanced to the penultimate scale, where the relative weighting of each item to the total score will be evaluated.
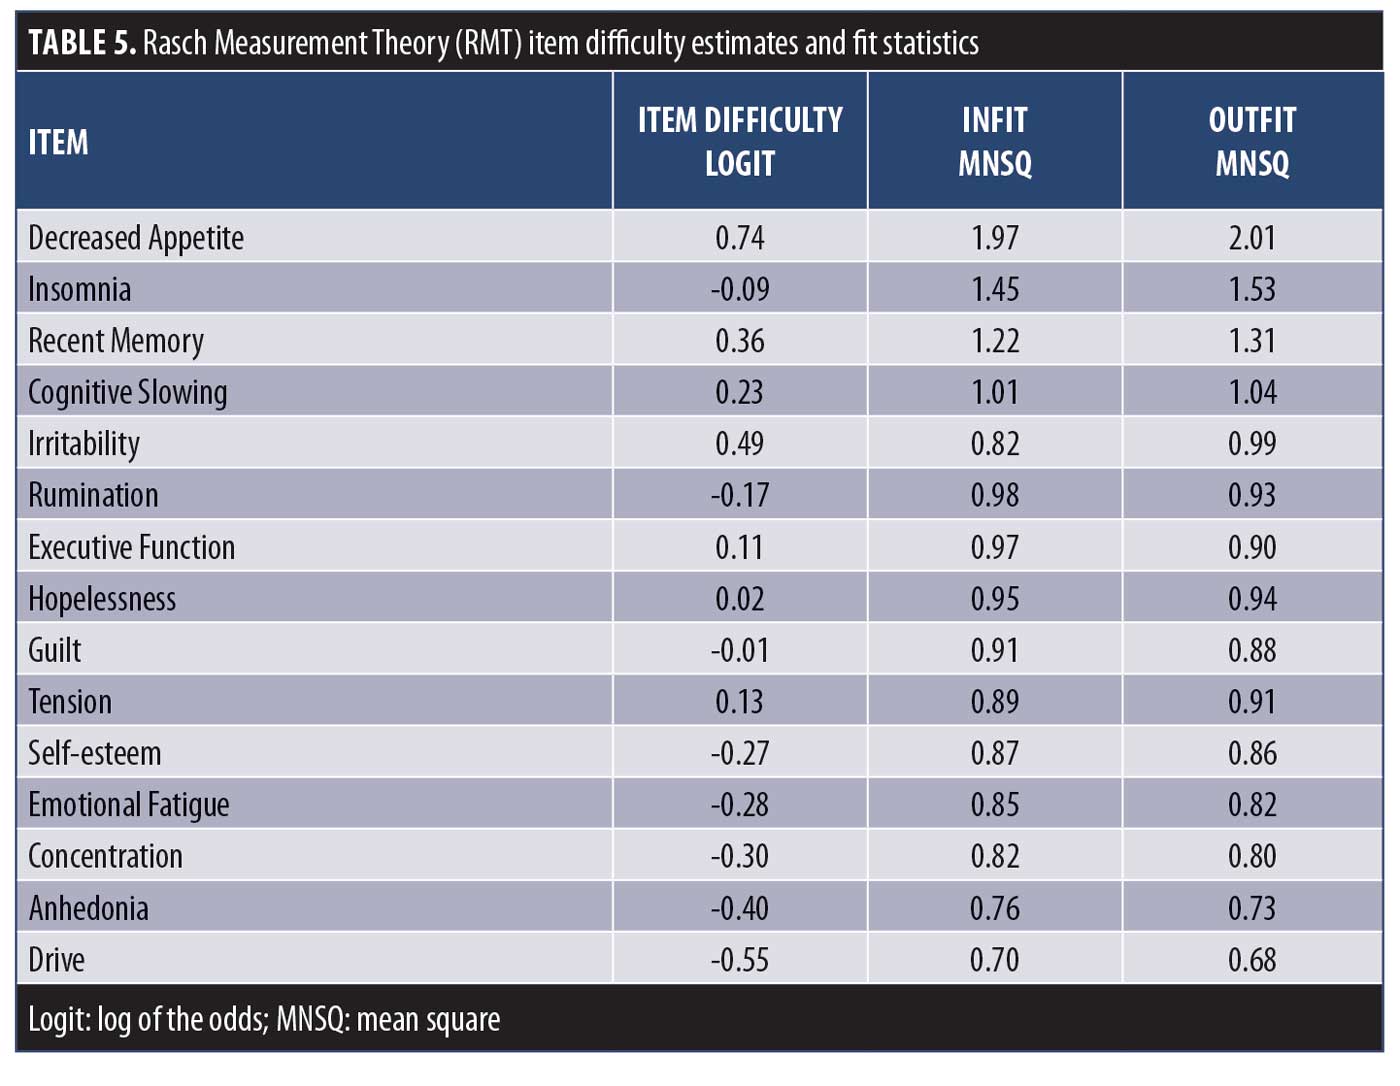
RMT analysis. The remaining 15 DID items were evaluated using RMT modeling. Item fit statistics and difficulty estimates are presented in Table 5. One item was identified as a possible misfit (Decreased Appetite), with Infit and Outfit MNSQ values of 1.97 and 2.01, respectively. All other items were found to have acceptable fit values. Person and item difficulty estimates for the DID items are shown in Figure 2 and Table 5. Ideally, items should be distributed across person severity levels (i.e., the range of participants for which the scale is intended). Four of the 387 observations were flagged as extreme scores (outliers) and removed. Person ability (in this context, depression level) ranged between -3.82 and 3.03 logits and item difficulty ranged between -0.55 logits (Drive) and 0.74 logits (Decreased Appetite), suggesting that items such as Anhedonia and Drive discriminate at lower levels of depression severity, while Decreased Appetite discriminates at higher levels. These results are consistent with the threshold parameters observed following IRT examination (Table 4). The proximity of the mean item measure (logit=0) to the mean person measure (logit= -0.35) indicates satisfactory item targeting, with visual inspection of Figure 2 suggesting that the DID items have less precision in persons with lower levels of depression.
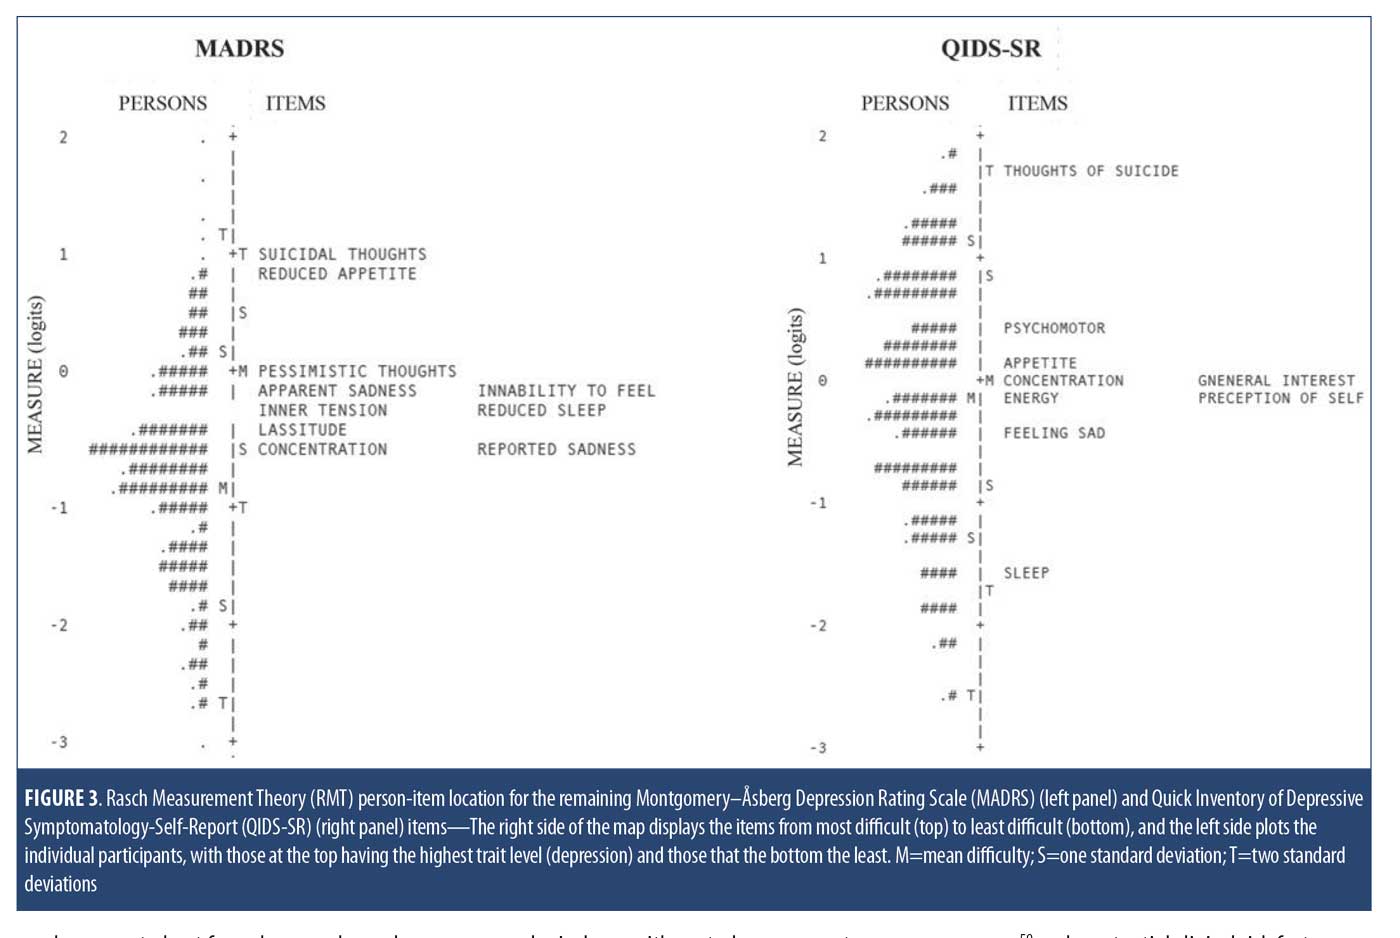
 For comparison, person-item maps for the MADRS and QIDS-SR items are shown in Figure 3. For the MADRS, problematic item targeting was evident as item difficulty distribution ranged between -0.52 logits and 1.03 logits, which falls above the mean person measure of -0.82 logits. This suggests that the MADRS items target more severe depression than this MDD population had. In addition, the gap of items between -0.06 and 0.90 logits indicates poor precision for persons falling between those severity levels. For the QIDS-SR, precision was also an issue, as there were substantial gaps between items, with no QIDS-SR items targeting persons between 0.39 and 1.77 logits and between -1.62 and -0.39 logits.
Internal consistency. Cronbach’s alpha and item-total correlations were calculated for the remaining 15 DID items, as well as MADRS and QIDS-SR items. Alpha was high for the DID items at 0.95, and item-total correlations were all acceptable, ranging from r=0.49 (Decreased Appetite) to r=0.84 (Drive, Anhedonia). Given the satisfactory item-total correlations, summing items without differential item weighting or standardization is justified.41 Similarly, MADRS items showed a good internal consistency with alpha=0.89 and item-total correlations ranging from r=0.36 (Reduced Appetite) to r=0.82 (Reported Sadness). For the QIDS-SR items, internal consistency was also good (alpha=0.82), and inter-item correlations ranged from r=0.26 (Appetite/Weight) to r=0.70 (Feeling Sad). The low item-total correlations of the Appetite/Weight item (r<3) questions the construct validity of this item.
Sensitivity to change. The CAN-BIND protocol allowed us to assess sensitivity to change of the DID items by comparing baseline (pre-antidepressant treatment) to Week 8 (post-antidepressant treatment). Effect sizes were assessed using partial Eta2, with values of 0.01, 0.06, and 0.14 representing small, medium, and large effects sizes, respectively.42 Repeated Measures ANOVA revealed significant decreases for all DID items (all p< 0.01), with effects sizes ranging from 0.10 (Decreased Appetite) to 0.48 (Anhedonia) (Table 6).
Discussion
In the present study, we applied CTT, IRT, and RMT analyses to assess the performance of the DID items and identify which should be advanced, modified, or removed. This has been an iterative process in which improvements in item measurement properties are based on empirical grounds10 and using FDA recommendations as a guidance.20 We have successfully applied this approach to other scale development efforts as well.43,44,45,46,47 Furthermore, although there is no standard psychometric approach, we encourage evaluation using all three methods (CTT, IRT, RMT), as they provide complementary information that should be considered in evaluating item performance.19 Based on the results, 15 DID items are recommended for inclusion in the penultimate scale: Anhedonia, Cognitive Slowing, Concentration, Executive Function, Recent Memory, Drive, Emotional Fatigue, Guilt, Self-esteem, Hopelessness, Tension, Rumination, Irritability, Reduced Appetite, and Insomnia, with modifications suggested for the Irritability, Reduced Appetite, and Insomnia items.
Appetite and Sleep Disturbances are included in the fifth edition of the DMS (DSM-5) symptom criteria for MDD, with Hypersomnia, Increased Appetite, and Weight Gain included as key features of atypical depression subtype in MDD.48 In the present study, DID items designed to assess Increased Appetite, Increased Eating, and Prolonged Sleep showed low response rates, with 72.3, 84.7, and 70.1 percent of participants, respectively, endorsing “Absent/Not at All” (Table 3), thus limiting their clinical utility in the present sample. It is important to note, however, that the MADRS was used to define CAN-BIND study entry criteria21 and it does not assess reversed neurovegetative symptoms, such as increased appetite and hypersomnia. It is possible, therefore, that these “atypical” symptoms might have been underrepresented in the CAN-BIND sample. Additional studies will be required to properly assess their properties in atypical MDD subtype.
Saturation of symptom assessment to assure that symptom domains important to the patients are captured is a component in the evaluation of new questionnaires.20 In previous iterations, we evaluated the Bech-6 subset of the GRID-HAM-D (Depressed Mood, Anxiety, Work and Activities, Feeling of Guilt and Somatic Symptoms, Retardation), with the Depressed Mood item showing favorable psychometric properties.6,11 As such, a DID version of the GRID-HAM-D Depressed Mood item24 will be included in the penultimate scale. However, although the HAM-D version of the Depressed Mood item is not meant to represent a global measure of depression, it simultaneously assesses multiple symptom constructs, including feelings of sadness along with feelings of hopelessness, helplessness, low self-esteem, pessimism, and worthlessness. This might be problematic, as these are distinct symptoms that might (or might not) be differentially experienced and possibly respond differently to treatment.38 Indeed, a factor analysis across depression rating scales demonstrated differential factor loading between the HAM-D Depressed Mood Item and the BDI Sadness item.49 A new DID Sadness item will be developed to determine if sadness is a distinct constituent symptom that can be separated out from depressed mood.
In the present study, Rumination was assessed as repetitive negative thinking about past events.50 Although rumination and worry are related and both are reported in MDD, worry typically involves anxiety about future events, whereas rumination is related to repetitive thinking about past events.51 Therefore, a DID Worry item will be developed to distinguish worry about past events (as assessed by the current DID Rumination item) from excessive worry about potentially negative events in the future.
Suicide is a major public health issue, with MDD cited as a common psychiatric disorder in people dying by suicide.52 Recognizing the importance of assessing suicide risk in clinical trials and the relationship between antidepressant use and the emergence or worsening of suicidal ideation,53,54 the FDA recommends that participants be monitored for suicidal ideation, impulses, and behaviors in “…all clinical trials involving any drug being developed for any psychiatric indication, as well as for all antiepileptic drugs and other neurologic drugs with central nervous system (CNS) activity, both inpatient and outpatient, including multiple-dose Phase I trials involving healthy volunteers.”55 In the next iteration, a suicide item adapted from the GRID-HAM-D will also be included. It is important to recognize, however, that assessment of suicidal ideation, impulses, and behavior in clinical research is complex and difficult to capture (and predict) by a single “global” scale item.56,57 Defining acute/severe suicidal ideation as an exclusion criterion can minimize risks; however, this can also result in selection bias and omission of the most severe cases and does not address concerns with respect to the potential relationship between antidepressant usage and suicidal ideation and the emergence of new suicidal behavior. Therefore, given the link between depression and suicide,52 as well as regulatory considerations,55 a comprehensive suicidality assessment measure should also be used to monitor and identify those at risk for suicide.58
Loss of Interest or Pleasure in Almost All Activities is considered a core diagnostic feature of MDD48 that is predictive of treatment response59 and a potential clinical risk factor for suicidal ideation.60 In the present study, six items were included to separately assess loss of interest with respect to various domains of activities, including Hobbies and Pastimes, Accomplishment, Social Activity–Friends, Social Activity–Family, Sexual Activity, and a general Anhedonia item. With the exception of Sexual Activity, all DID anhedonia items were moderately to strongly correlated with one another (r=0.54–0.78) with the general Anhedonia item showing the best psychometric properties, supporting anhedonia as a core feature of MDD that is not domain specific. The weaker correlations with the Sexual Activity item (r=0.27–0.45), however, suggests that loss of interest/pleasure in sexual activity (as assessed in the present study) might also be related to factors other than anhedonia, including potential antidepressant side-effects.61
The DID grid structure operationalizes intensity and frequency of each item, and allows these to be rated simultaneously, with clear symptom definitions and a structured interview guide provided.10 Conventions for administering the scale have been developed, and the grid format appears to be user-friendly and has acceptable agreement among independent raters.24,62 An updated version of the DID scale (19 items) is undergoing validation within the CAN-BIND program, including aspects of reliability (internal consistency, inter-rater, test-retest) and validity (concurrent, discriminant, convergent). If you would like to receive a copy of the DID items please contact the corresponding author.
Acknowledgments
We would like to acknowledge the individuals and organizations that have made data available for this research, including CAN-BIND, the Ontario Brain Institute, the Brain-CODE platform, and the government of Ontario. We thank the CAN-BIND coordinators and raters.
References
- Hamilton M. A rating scale for depression. J Neurol Neurosurg Psychiatry. 1960;23:56–62.
- Montgomery SA, Åsberg M. A new depression scale designed to be sensitive to change. Br J Psychiatry. 1979;134:382–389.
- Reidel M, Möller H-J, Obermeier M, et al. Response and remission criteria in major depression: a validation of current practice. J Psychiatr Res. 2010;44(15):1063–1068.
- Bagby RM, Ryder AG, Schuller DR, et al. The Hamilton Depression Rating Scale: Has the gold standard become a lead weight? Am J Psychiatry. 2004;161(12):2163–2177.
- Carmody TJ, Rush AJ, Bernstein I, et al. The Montgomery-Åsberg and the Hamilton ratings of depression: a comparison of measures. Eur Neuropsychopharmacol. 2006;16(8):601–611.
- Evans KR, Sills T, DeBrota DJ, et al. An item response analysis of the Hamilton Depression Rating Scale using shared data from two pharmaceutical companies. J Psychiatr Res. 2004;38(3):275–284.
- Santor DA, Coyne JC. Examining symptom expression as a function of symptom severity: item performance on the Hamilton Rating Scale for Depression. Psychol Assess. 2001;13(1):127–139.
- Adler M, Hetta J, Isacsson G, et al. An item response theory evaluation of three depression assessment instruments in a clinical sample. BMC Med Res Methodol. 2012;12:1–12
- Davidson J, Turnbull CD, Strickland R, et al. The Montgomery-Åsberg Depression Scale: reliability and validity. Acta Psychiatr Scand. 1986;73(5):544–548.
- Vaccarino AL, Evans KR, Kalali AH, et al. The Depression Inventory Development Workgroup: a collaborative, empirically driven initiative to develop a new assessment tool for major depressive disorder. Innov Clin Neurosci. 2016;13(9-10):20-31
- Vaccarino AL, Evans KR, Sills TL, et al. Symptoms of anxiety in depression: assessment of item performance of the Hamilton Anxiety Rating Scale in patients with depression. Depress Anxiety. 2008;25(12):1006–1013.
- Vaccarino AL, Sills TL, Evans KR, et al. Prevalence and association of somatic symptoms in patients with major depressive disorder. J Affect Disord. 2008;110(3):270–276.
- Vaccarino AL, Sills TL, Evans KR, et al. Multiple pain complaints in patients with major depressive disorder. Psychosom Med. 2009;71(2):159–162.
- Devellis, RF. Classical Test Theory. Med Care. 2006;44(11 Suppl 3);S50-59.
- Cappelleri JC, Lundy JJ, Hays RD. Overview of Classical Test Theory and Item Response Theory for quantitative assessment of items in developing patient-reported outcome measures. Clin Ther. 2014;36(5):648–662.
- Hays RD, Morales LS, Reise SP. Item Response Theory and health outcomes measurement in the 21st century. Med Care. 2000;38(9) Suppl:II28–II42.
- Andrich, D. Rating scales and Rasch measurement. Expert Rev Pharmacoecon Outcomes Res. 2011;11(5):571-85.
- Patrick DL. Many ways to skin a cat: psychometric methods options illustrated. J Patient Rep Outcomes. 2019;3:48.
- Petrillo J, Cano SJ, McLeod LD, Using Classical Test Theory, Item Response Theory, and Rasch Measurement Theory to evaluate patient-reported outcome measures: a comparison of worked examples. Value Health. 2015;18(1):25-34
- United States Department of Health and Human Services. Food and Drug Administration. Guidance for industry. Patient-reported outcome measures: use in medical product development to support labeling claims. Fed Reg. 2009;74:65132–65133.
- Lam RW, Milev R, Rotzinger S, et al. Discovering biomarkers for antidepressant response: protocol from the Canadian Biomarker Integration Network in Depression (CAN-BIND) and clinical characteristics of the first patient cohort. BMC Psychiatry. 2016;16:105.
- Kennedy SH, Lam RW, Rotzinger S, et al. Symptomatic and functional outcomes and early prediction of response to escitalopram monotherapy and sequential adjunctive aripiprazole therapy in patients with major depressive disorder: a CAN-BIND-1 report. J CLin Psychiatry. 2019;80(2):18m12202.
- Sheehan DV, Lecrubier Y, Sheehan KH, et al. The Mini-International Neuropsychiatric Interview (M.I.N.I.): the development and validation of a structured diagnostic psychiatric interview for DSM-IV and ICD-10. J Clin Psychiatry. 1998;59(Suppl 20):22–33.
- Williams JB, Kobak KA, Bech P, et al. The GRID-HAM-D: standardization of the Hamilton Depression Rating Scale. Int Clin Psychopharmacol. 2008;23(3):120–129.
- Rush AJ, Trivedi MH, Ibrahim HM, et al. The 16-Item Quick Inventory of Depressive Symptomatology (QIDS)–Clinician Rating (QIDS-C), and –Self-Report (QIDS-SR): a psychometric evaluation in patients with chronic major depression. Biol Psychiatry. 2003;54(5):573-583
- Vaccarino AL, Dharsee M, Strother S, et al. Brain-CODE: a secure neuroinformatics platform for management, federation, sharing and analysis of multi-dimensional neuroscience data. Front Neuroinform. 2018;12(28):1-14.
- Samejima, F. Estimation of a latent ability using a response pattern of graded scores. Psychometrika Monographs. 1969;34(Suppl. 4).
- Baker FB. The Basics of Item Response Theory, Second Edition. College Park, MD: ERIC Clearinghouse on Assessment and Evaluation; 2001.
- Hambleton RK, Swaminathan H, Rogers HJ. Fundamentals of Item Response Theory. Newbury Park, CA: Sage Publications, Inc.;1991.
- Nguyen TH, Han HR, Kim MT, et al. An introduction to Item Response Theory for patient-reported outcome measurement. Patient. 2014;7(1):23–35.
- Wright BD, Linacre JM. Reasonable mean-square fit values. Rasch Measurement Transactions. 1994;8:370-371.
- Stelmack J, Szlyk JP, Stelmack T, et al. Use of Rasch person-item map in exploratory data analysis: a clinical perspective. J Rehabil Res Dev. 2004;41(2):233–241.
- Boone WJ. Rasch analysis for instrument development: why, when, and how? CBE Life Sci Educ. 2016;15(4): rm4.
- Kessler R, McGonagle K, Zhao S, et al. Lifetime and 12-month prevalence of DSM-III-R psychiatric disorders in the United States: results from the National Comorbidity Survey. Arch Gen Psychiatry. 1994;51:8–19.
- Gater R, Tansella M, Korten A, et al. Sex differences in the prevalence and detection of depressive and anxiety disorders in general health care settings: report from the World Health Organization collaborative study on psychological problems in general health care. Arch Gen Psychiatry. 1998;55:405–413.
- Salk RH., Hyde JS, Abramson LY. Gender differences in depression in representative national samples: meta-analyses of diagnoses and symptoms. Psychologic Bull. 2017;143(8):783–822.
- Haroz EE, Ritchey M, Bass JK, et al. How is depression experienced around the world? a systematic review of qualitative literature. Soc Sci Med. 2017;183:151-162
- Zimmerman M, Posternak MA, Chelminski I. Is it time to replace the Hamilton Depression Rating Scale as the primary outcome measure in treatment studies of depression? J Clin Psychopharmacol. 2005;25(2):105–110.
- Culpepper L, Lam RW, McIntyre RS. Cognitive impairment in patients with depression: awareness, assessment, and management. J Clin Psychiatry. 2017;78(9):1383–1394.
- Shilyansky C, Williams LM, Gyurak A, et al. Effect of antidepressant treatment on cognitive impairments associated with depression: a randomised longitudinal study. Lancet Psychiatry. 2016;3(5):425-435.
- Hobart J, Lamping D, Fitzpatrick R, et al. The Multiple Sclerosis Impact Scale (MSIS-29): a new patient-based outcome measure. Brain. 2001;(124):962–973.
- Fritz CO, Morris PE, Richler JJ. (2012). Effect size estimates: current use, calculations, and interpretation. J Exp Psychol. 2012;(141):2–18.
- Vaccarino AL, Sills T, Anderson KE, et al. Assessment of cognitive symptoms in prodromal and early Huntington disease. PLoS Curr. 2011;(3):RRN1250.
- Vaccarino AL, Sills T, Anderson KE, et al. Assessment of day-to-day functioning in prodromal and early Huntington’s disease. PLoS Curr. 2011;(3):RRN1262.
- Vaccarino AL, Sills T, Anderson KE, et al. Assessing behavioural manifestations prior to clinical diagnosis of Huntington’s disease: “Anger and Irritability” and “Obsessions and Compulsions.” PLoS Curr. 2011;(3):RRN124.
- Vaccarino AL, Sills T, Anderson KE, et al. Assessment of motor symptoms and functional impact in prodromal and early Huntington’s disease. PLoS Curr. 2011;(2):RRN1244.
- Vaccarino AL, Sills T, Anderson KE, et al. Assessment of depression, anxiety, and apathy in prodromal and early Huntington’s disease. PLoS Curr. 2011;(3):RRN1242.
- American Psychiatric Association. Diagnostic and Statistical Manual of Mental Disorders, Fifth Edition. Washington, DC: American Psychiatric Press Inc.; 2013.
- Uher R, Farmer A, Maier W, et al. Measuring depression: comparison and integration of three scales in the GENDEP study. Psychol Med. 2008;38(2):289-300.
- Rippere V. Some cognitive dimensions of antidepressive behaviour. Behav Res Ther. 1977;15 (1):57–63.
- Arditte Hall KA, Quinn ME, Vanderlind WM, et al. Comparing cognitive styles in social anxiety and major depressive disorders: an examination of rumination, worry, and reappraisal. Br J Clin Psychol. 2019;58(2):231-244.
- O’Rourke MC, Jamil RT, Siddiqui W. Suicide screening and prevention. Last update: 12 Apr 2020. StatPearls [internet]. National Center for Biotechnology Information. National Library of Medicine. National Institutes of Health. https://www.ncbi.nlm.nih.gov/books/NBK531453/. Accessed 7 Oct 2020.
- Fergusson D, Doucette S, Glass KC, et al. Association between suicide attempts and selective serotonin reuptake inhibitors: systematic review of randomised controlled trials. BMJ. 2005;330:1-7.
- Hengartner MP, Plöderl M. Newer-generation antidepressants and suicide risk in randomized controlled trials: a re-analysis of the FDA database. Psychother Psychosom. 2019;88(4):247–248.
- Unites States Department of Health and Human Services. United States Food and Drug Administration. Center for Drug Evaluation and Research (CDER). Guidance for Industry: Suicidal Ideation and Behavior: Prospective Assessment of Occurrence in Clinical Trials, Draft Guidance. August 2012. http://www.fda.gov/Drugs/GuidanceComplianceRegulatoryInformation/Guidances/default.htm. Accessed 7 Oct 2020.
- Giddens JM, Sheehan DV. The complexity of assessing overall severity of suicidality: a case study. Innov Clin Neurosci. 2014;11(9-10):164–171.
- Simon GE, Rutter CM, Peterson D, et al. Does response on the PHQ-9 Depression Questionnaire predict subsequent suicide attempt or suicide death? Psychiatr Serv. 2013;64(12):1195–1202.
- Giddens JM, Sheehan KH, Sheehan DV. The Columbia-Suicide Severity Rating Scale (C–SSRS): Has the “Gold Standard” become a liability? Innov Clin Neurosci. 2014;11(9-10):66–80.
- Allen TA, Lam RW, Milev R, et al. Early change in reward and punishment sensitivity as a predictor of response to antidepressant treatment for major depressive disorder: a CAN-BIND-1 report. Psychol Med. 2019;49(10):1629–1638.
- Ducasse D, Loas G, Dassa D, et al. Anhedonia is associated with suicidal ideation independently of depression: a meta-analysis. Depress Anxiety. 2018;35(5):382–392.
- Segraves RT. Antidepressant-induced sexual dysfunction. J Clin Psychiatry. 1998;59(Suppl 4):48–54.
- Williams JB. A structured interview guide for the Hamilton Depression Rating Scale. Arch Gen Psychiatry. 1988;45(8):742–747.